Explore Splunk Application Pages
Path:
/application/pages
This page explains what each Splunk dashboard page displays and when to use it during monitoring or troubleshooting.
Overview Dashboard
Section titled “Overview Dashboard”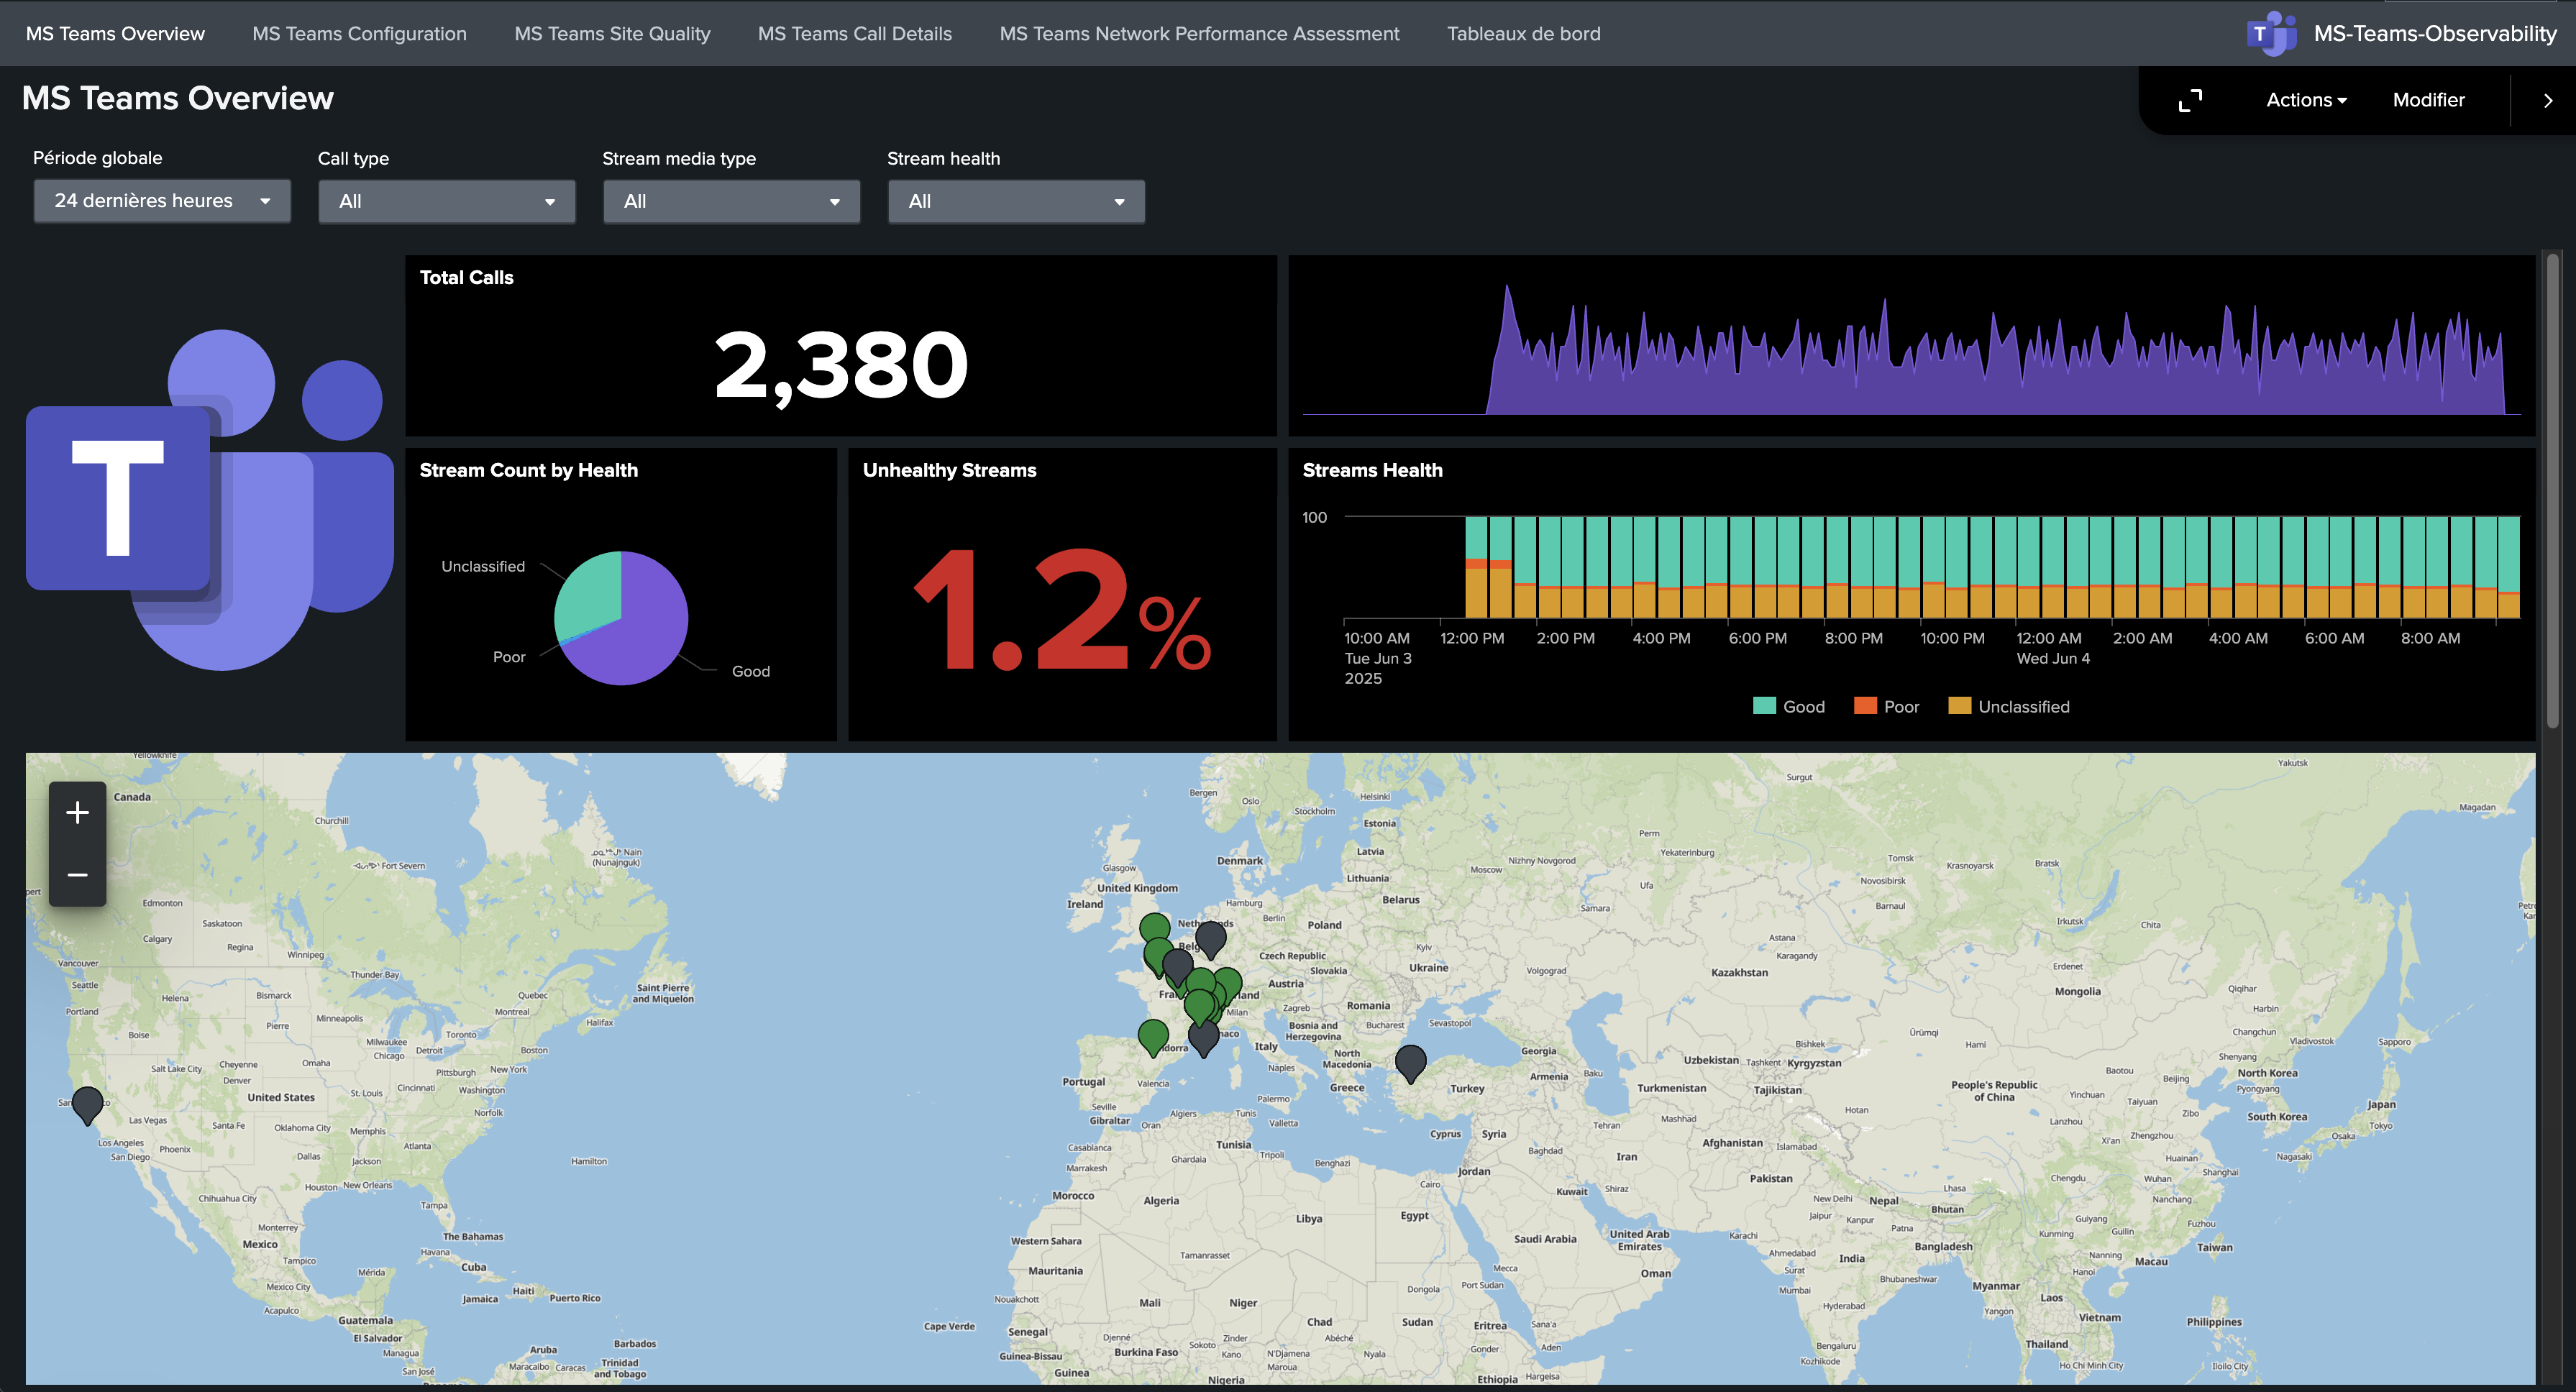
What it displays:
- Global call activity over time.
- High-level quality distribution.
- Main trends used for first-level monitoring.
When to use it:
- Daily health checks.
- Quick detection of tenant-wide degradation.
- Entry point before deeper dashboard analysis.
Call Details Dashboard
Section titled “Call Details Dashboard”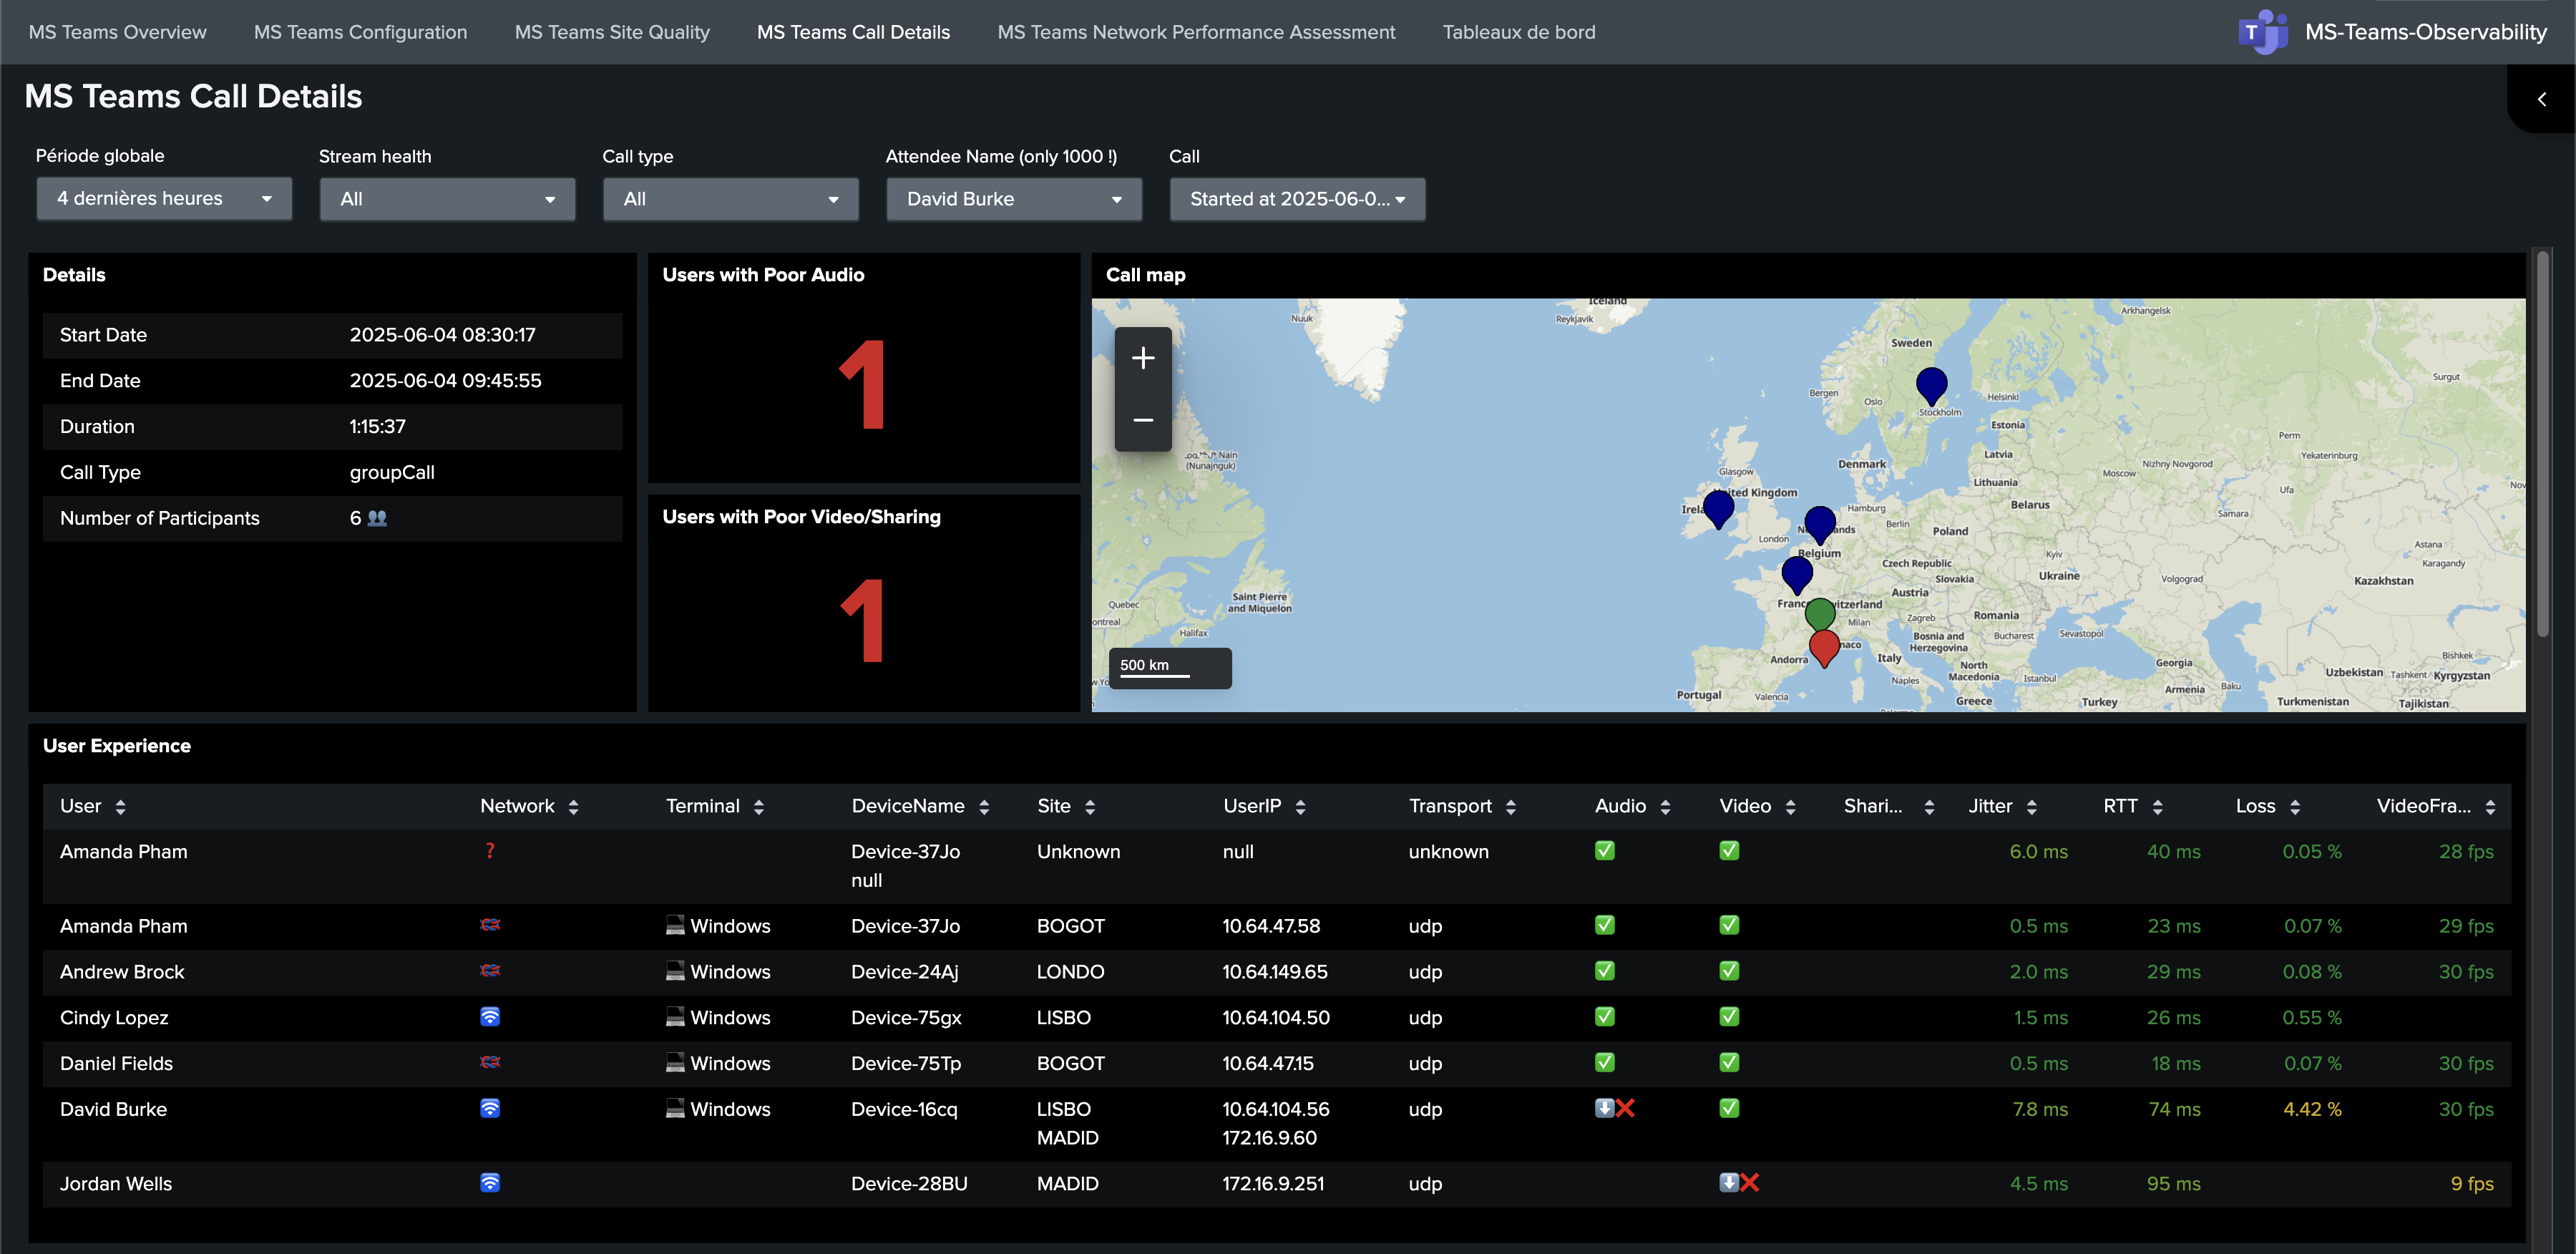
What it displays:
- Call-level records and participant details.
- Quality metrics for specific calls.
- Context needed for focused troubleshooting.
When to use it:
- Investigate one reported call issue.
- Compare poor vs healthy calls.
- Extract evidence for escalation.
Site Quality Dashboard
Section titled “Site Quality Dashboard”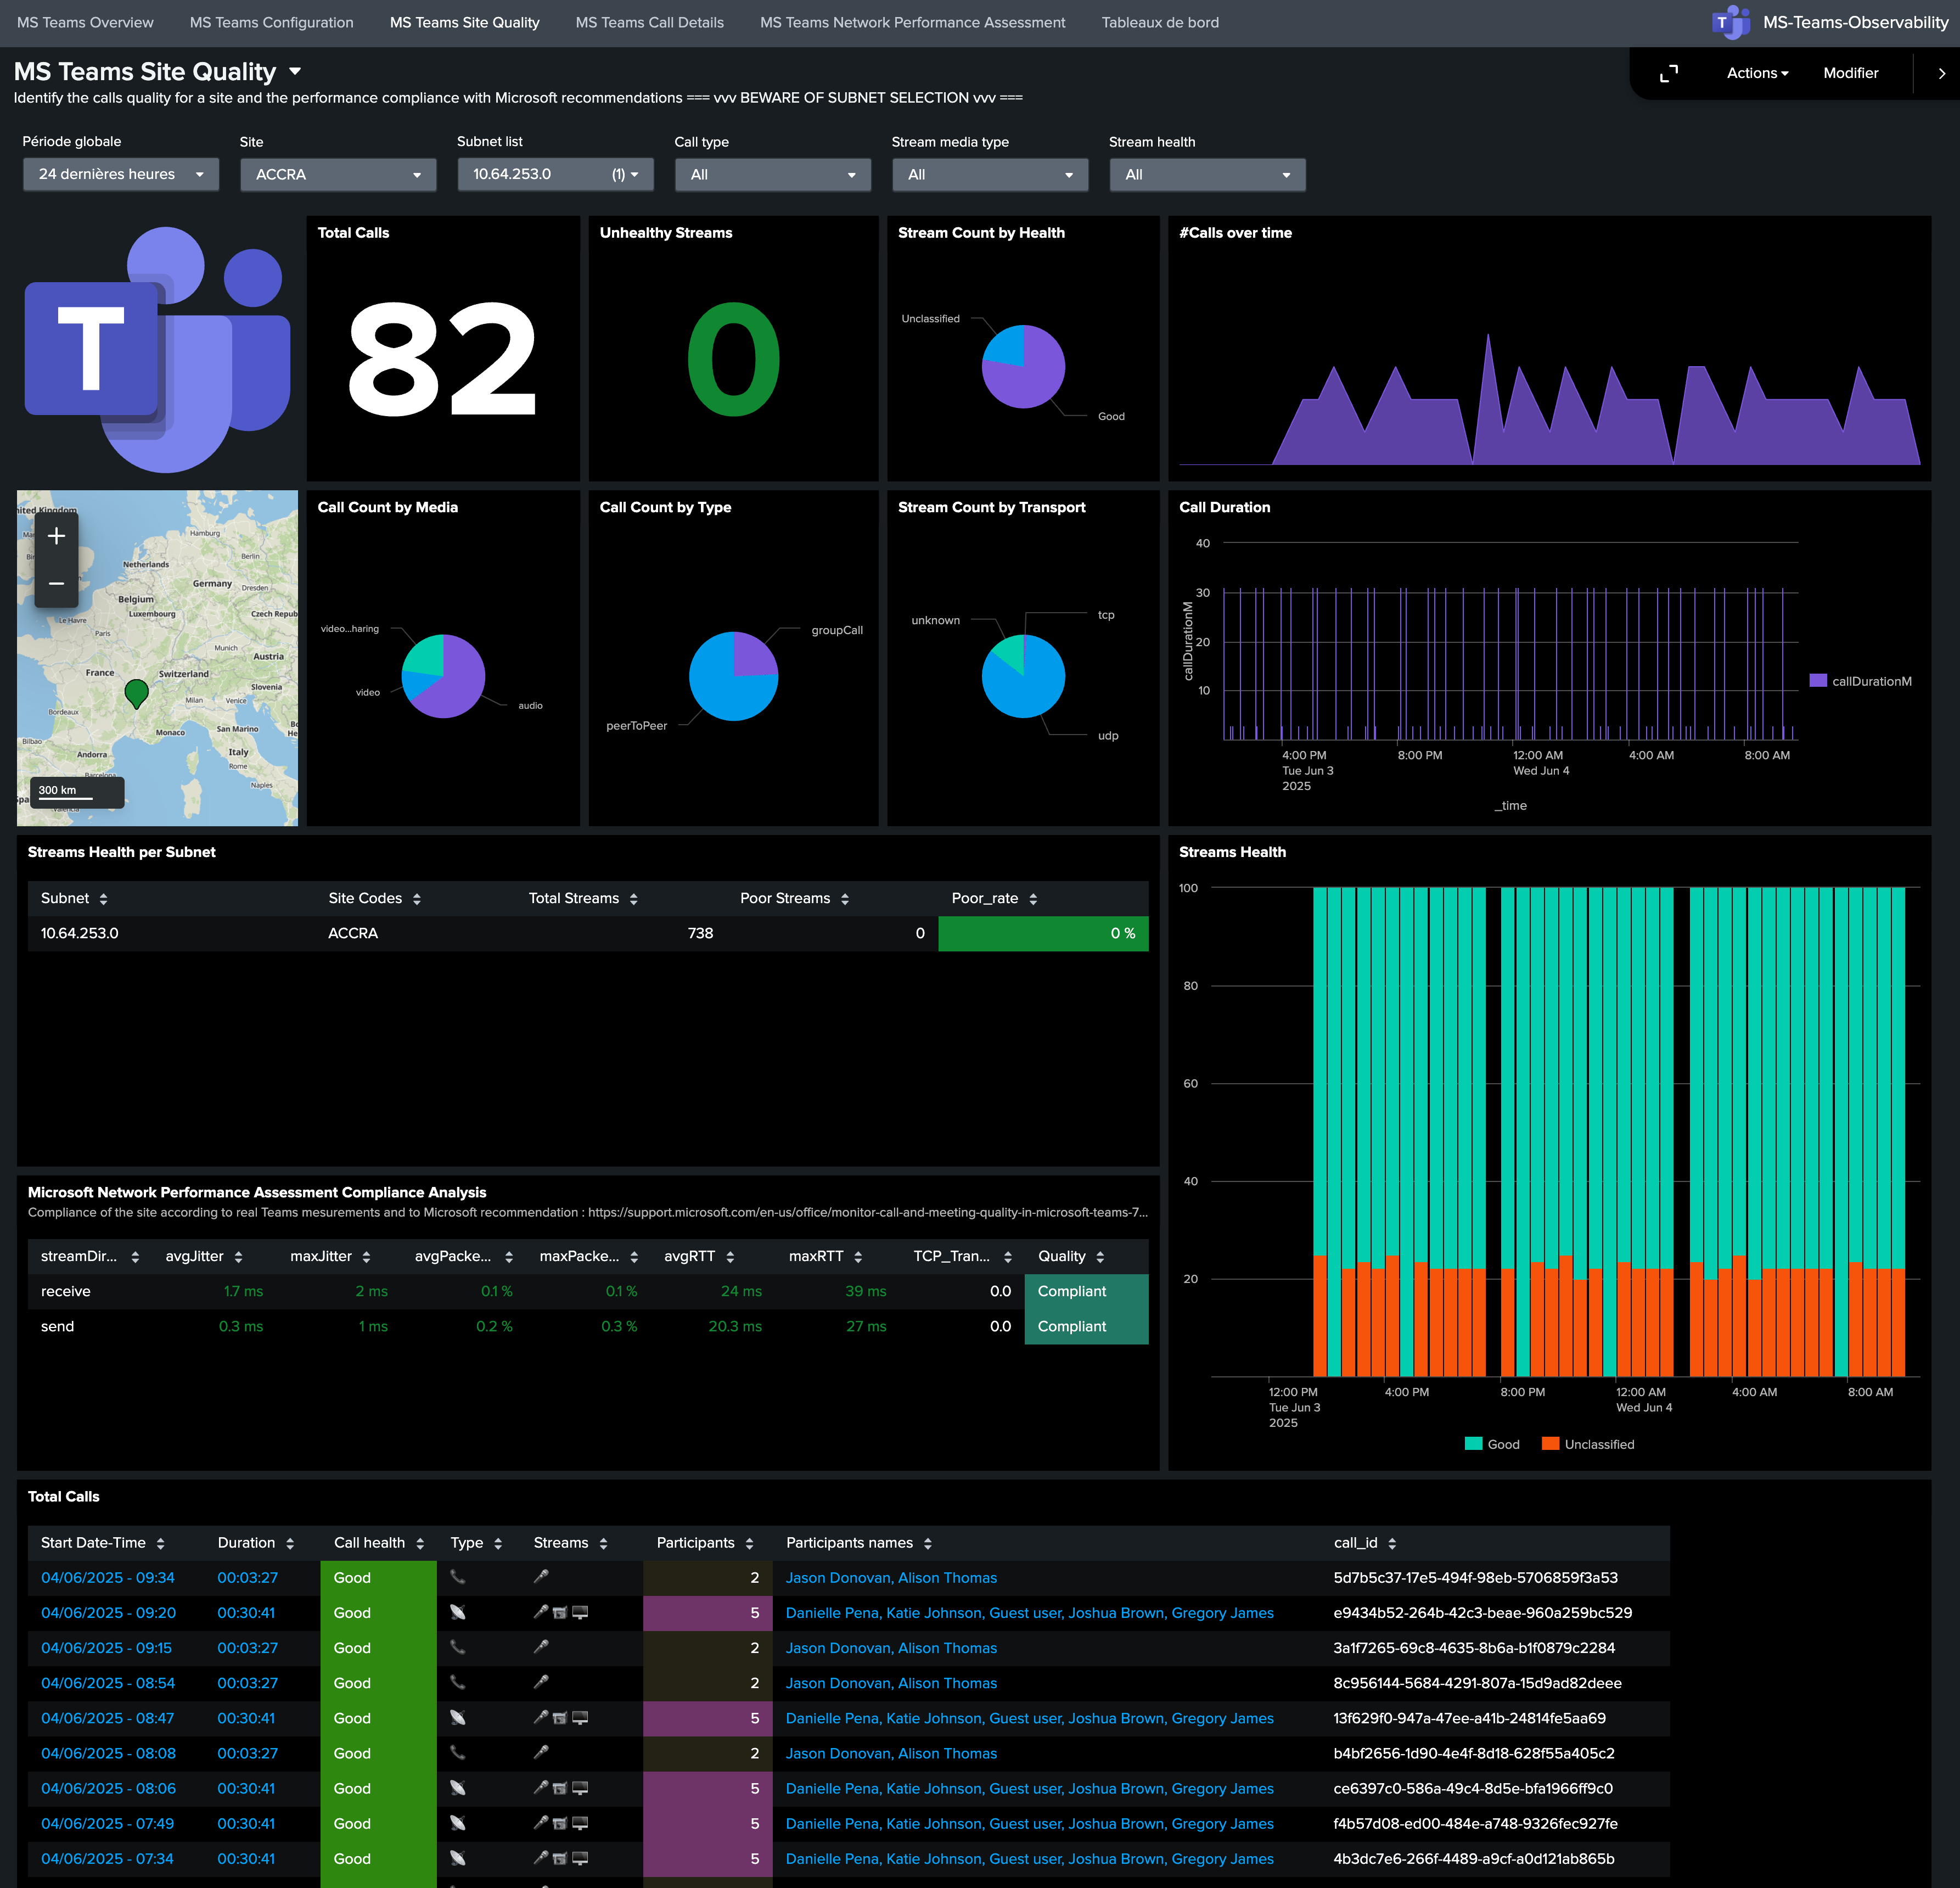
What it displays:
- Call quality by site/location.
- Distribution of issues by subnet/site.
- Geographic/network concentration of degradations.
When to use it:
- Identify affected offices/regions.
- Prioritize site-level remediation.
- Correlate local network behavior with quality drops.
NPA Dashboard
Section titled “NPA Dashboard”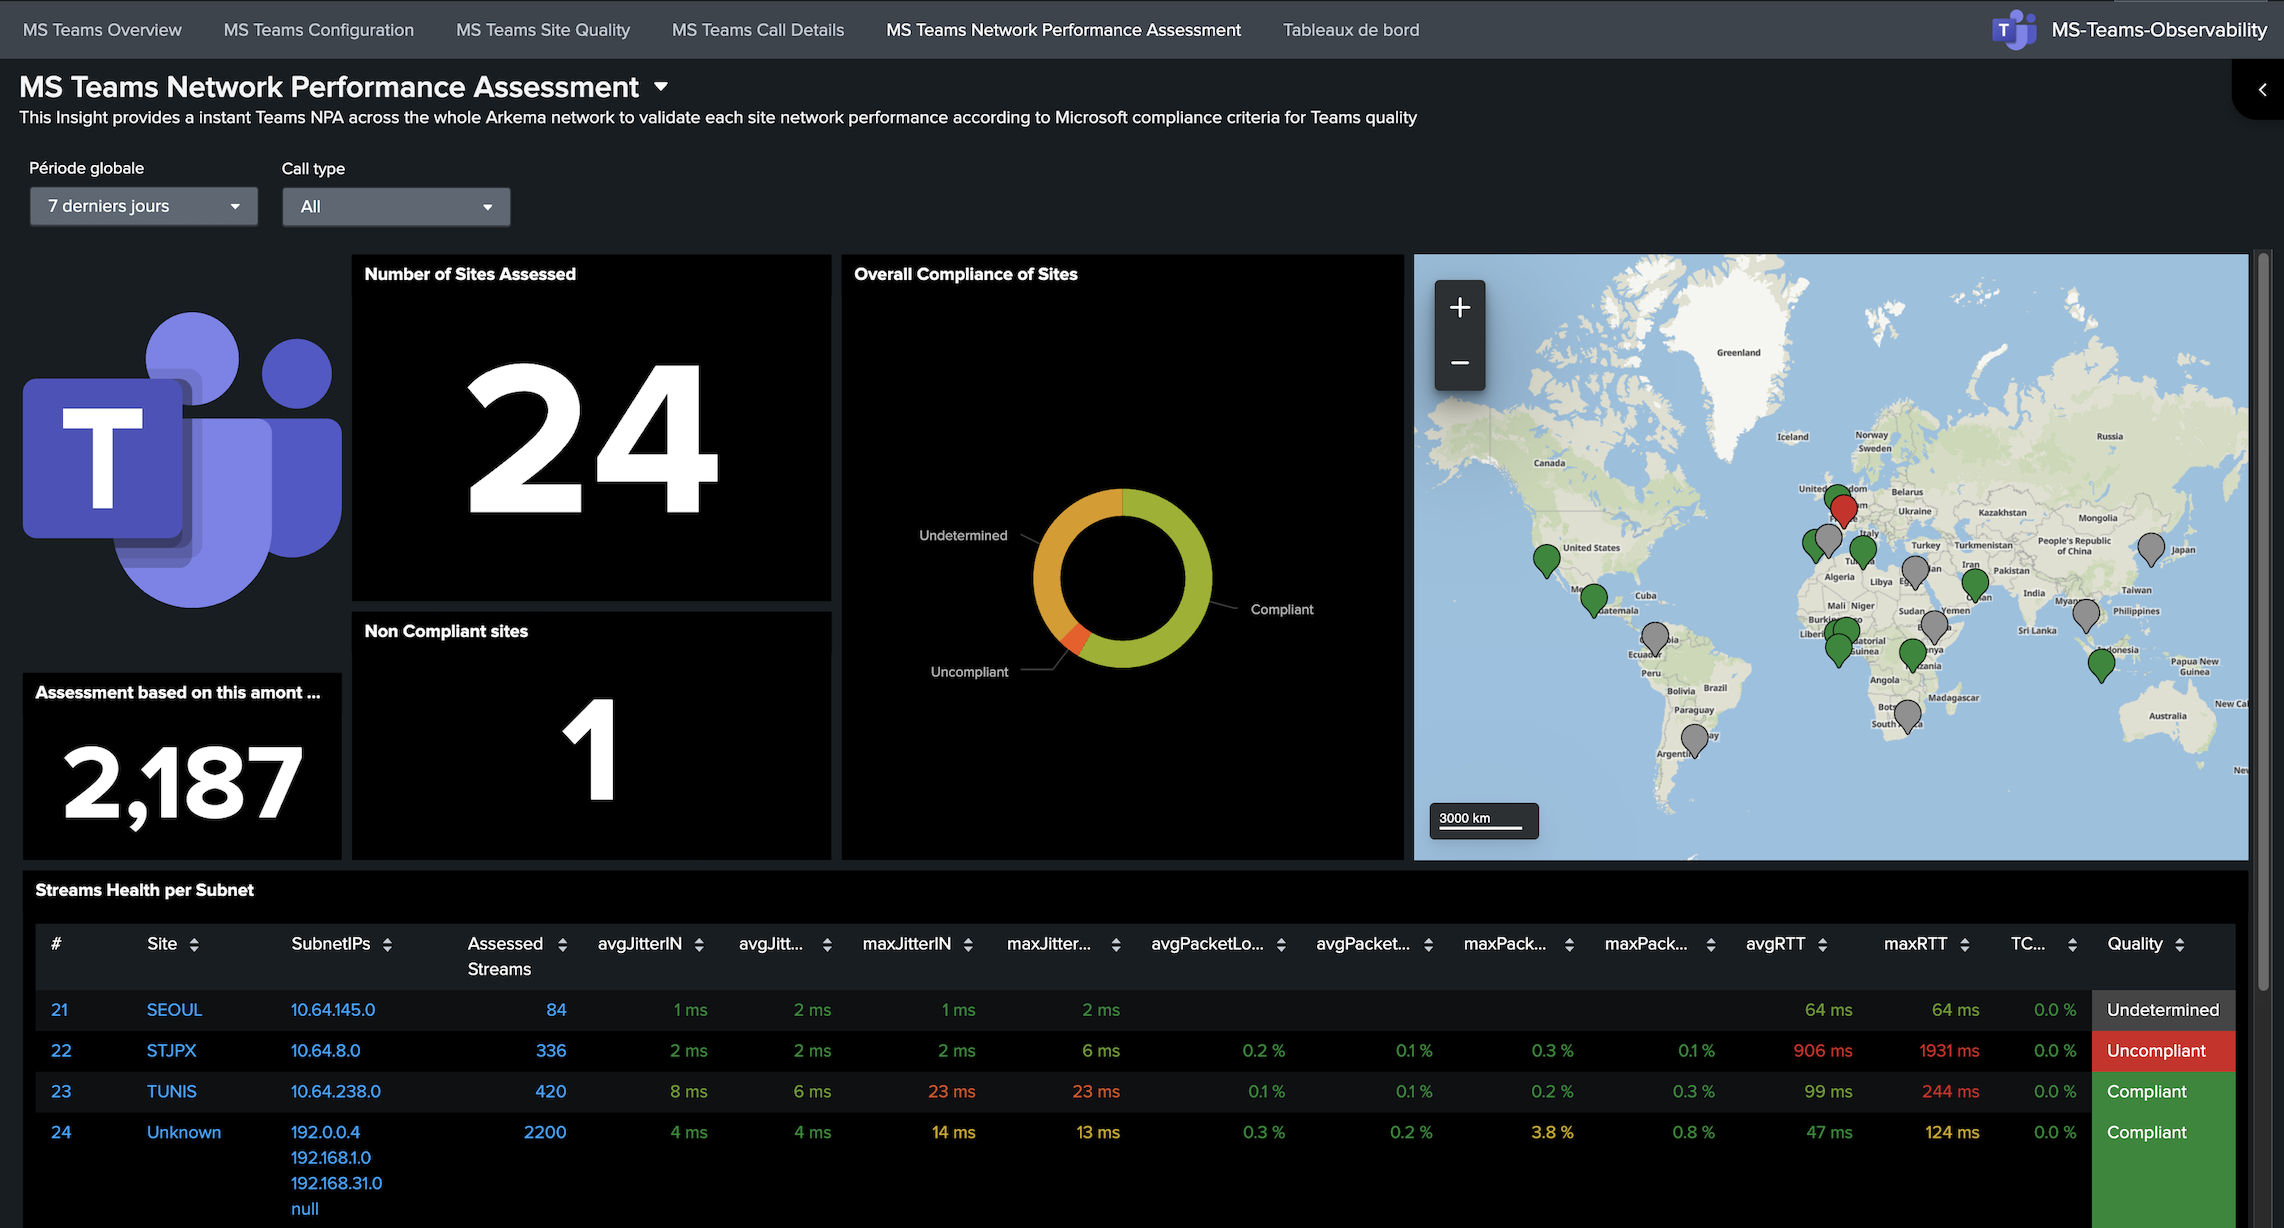
What it displays:
- NPA-oriented network quality indicators.
- Compliance/non-compliance patterns.
- Signals linked to Microsoft network recommendations.
When to use it:
- Validate network quality posture.
- Detect locations failing NPA expectations.
- Support network-team handoff with objective indicators.
Configuration Dashboard
Section titled “Configuration Dashboard”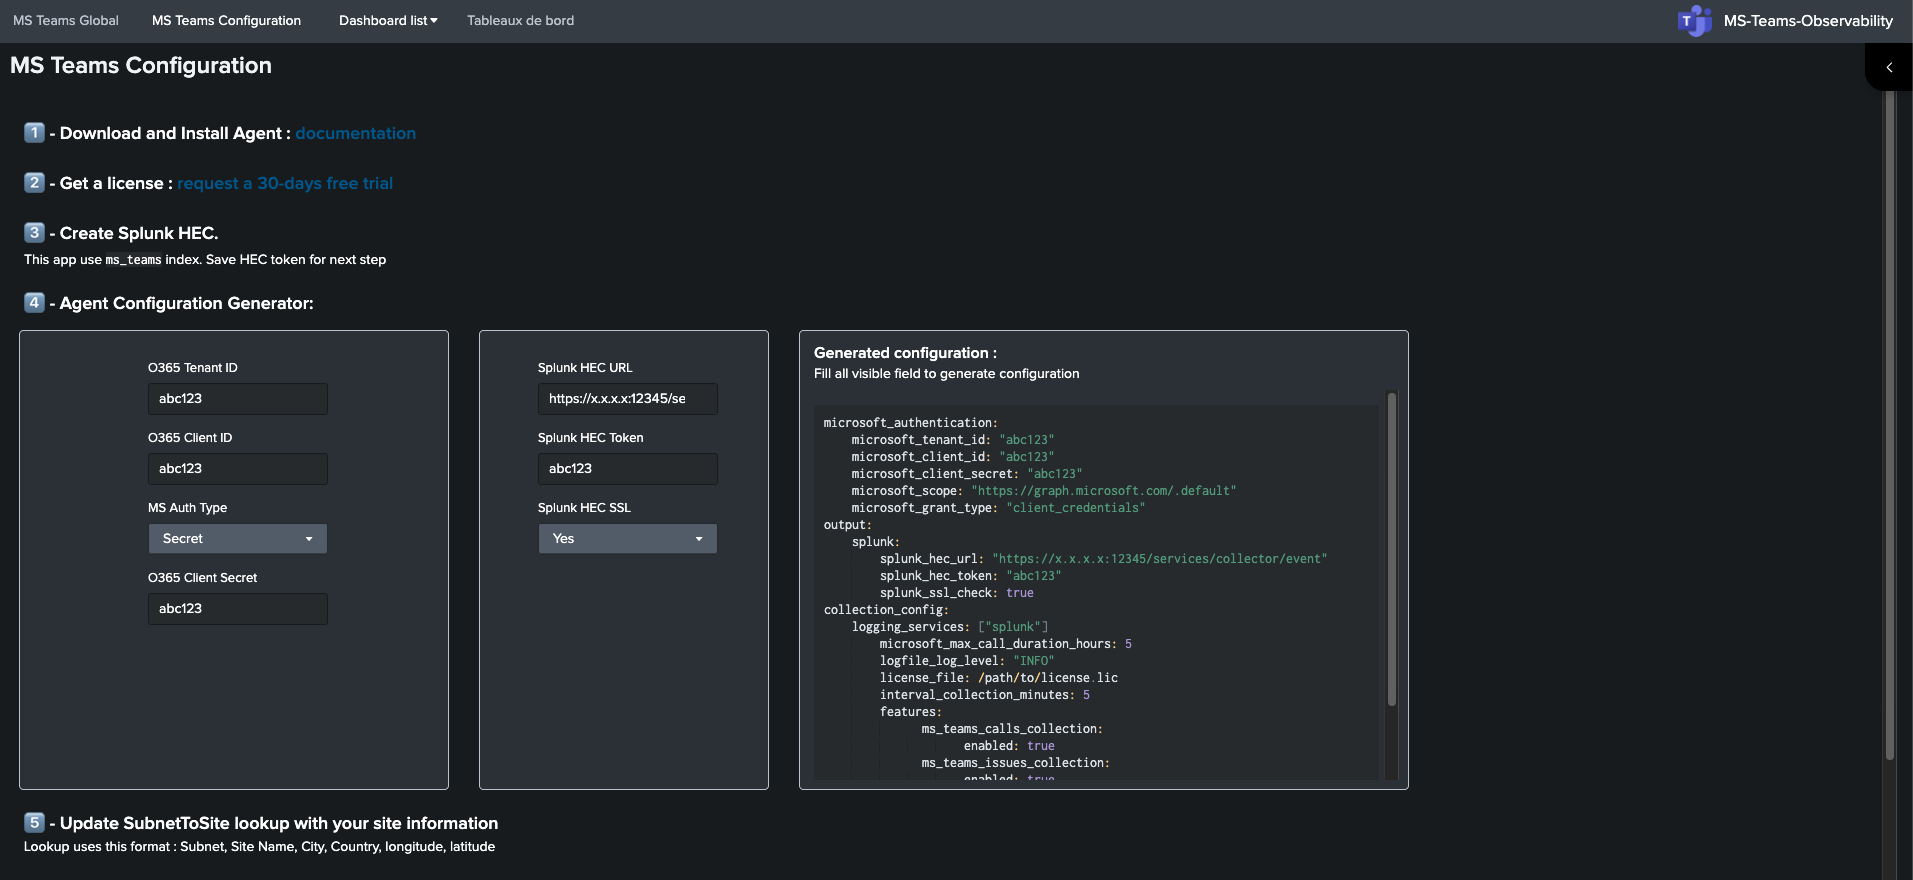
What it displays:
- Setup guidance and key prerequisites.
- Checks related to data arrival and dashboard usability.
- Operational configuration references.
When to use it:
- Initial setup and post-install validation.
- Troubleshooting ingestion/setup issues.
- Re-validation after environment changes.