
Application — Issues
Tab label: Issues — Default time range: Last 7 days
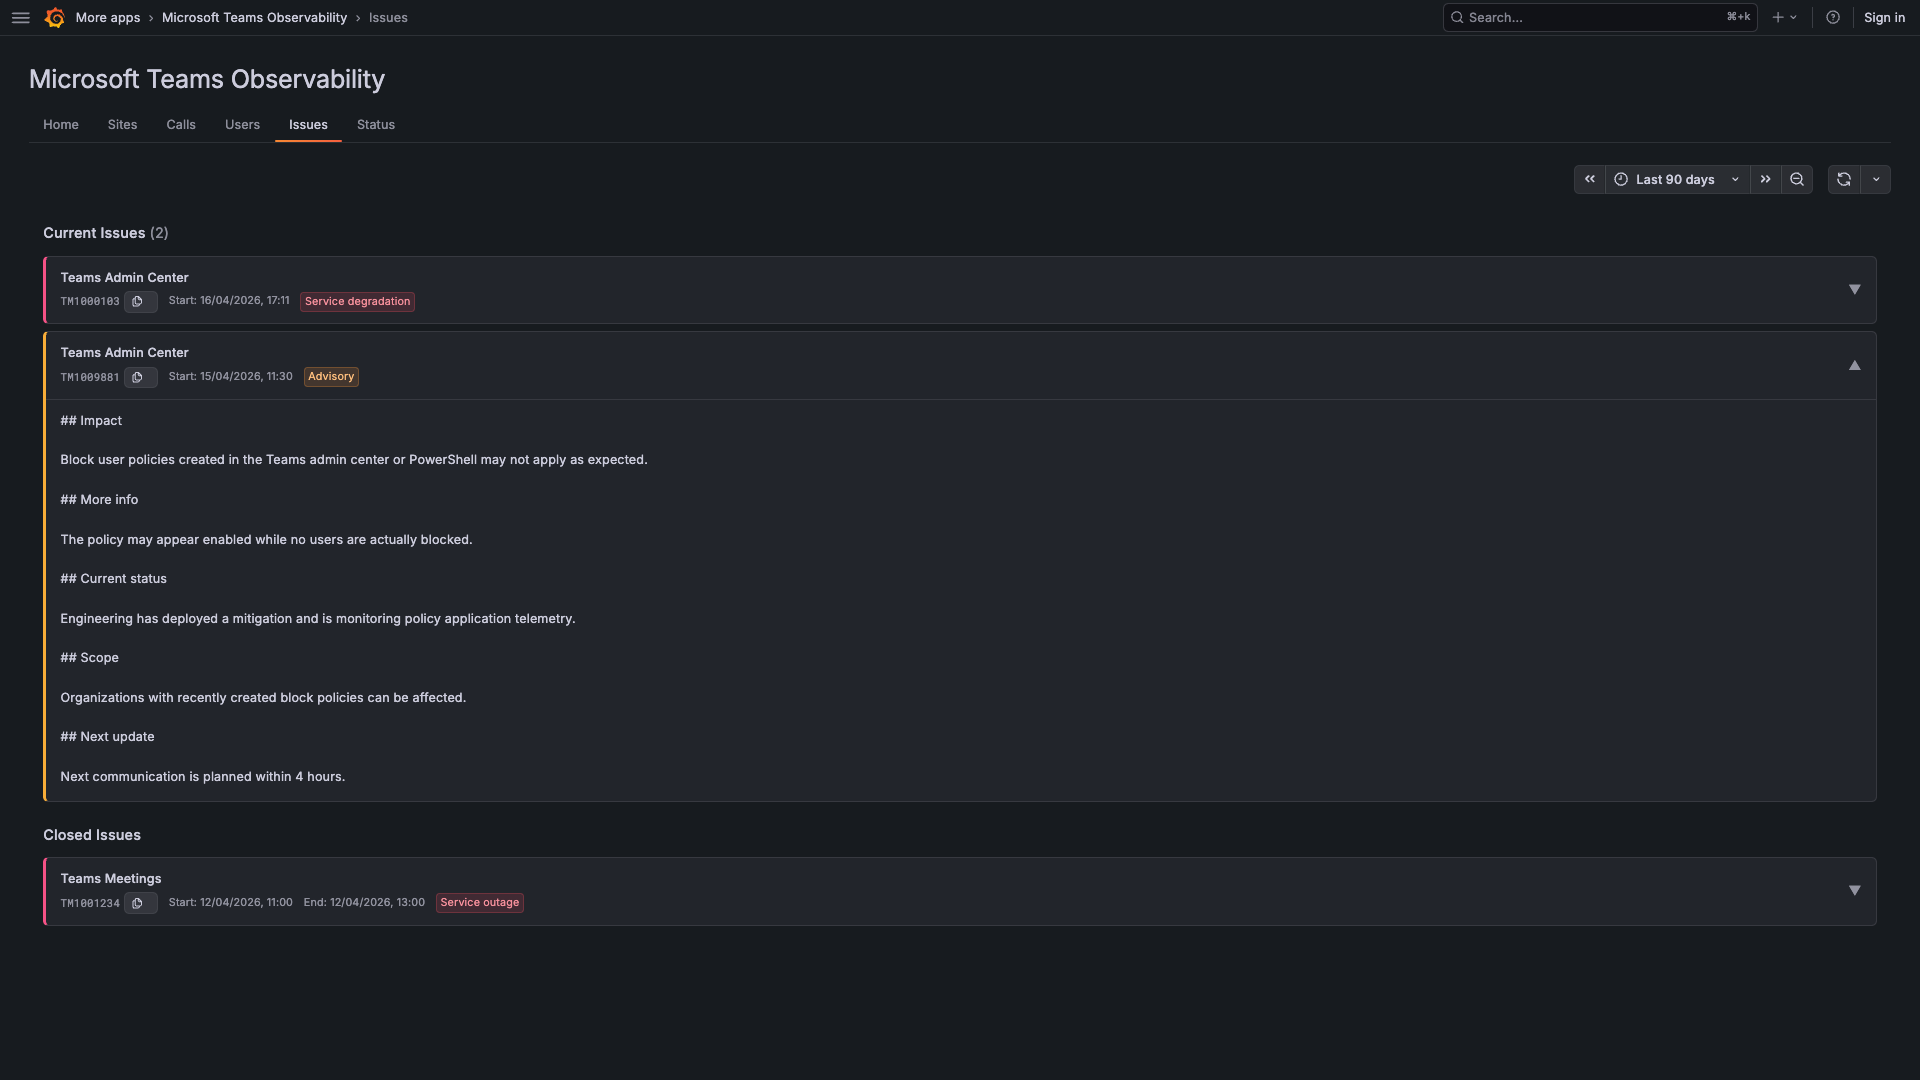
The Issues tab displays Microsoft 365 service health incidents that may impact your Teams environment. Data comes from the MSTeams_ServiceAnnouncement log source published by Microsoft’s service health API.
Use this tab to correlate call quality drops with known Microsoft incidents:
- Notice a quality drop on Home or Sites
- Check Issues for active incidents in the same timeframe
- If a matching incident exists → Microsoft-side issue, no configuration change needed
Filter Bar
Section titled “Filter Bar”Timeframe Selector
Section titled “Timeframe Selector”Controls which closed issues are shown (issues that ended within the selected time range). Currently active issues are always shown regardless of the timeframe.
Stored in URL as ?from=...&to=....
Update Button
Section titled “Update Button”Fetches issues for the selected timeframe. Highlighted when the timeframe has changed but not yet applied.
Section 1: Current Issues
Section titled “Section 1: Current Issues”Displays all currently open / active Microsoft service incidents.
Header: “Current Issues” with an issue count badge.
Empty state: “No current issues” — shown when all Microsoft services are healthy.
Section 2: Closed Issues
Section titled “Section 2: Closed Issues”Displays recently resolved Microsoft service incidents within the selected timeframe.
Header: “Closed Issues”
Empty state: “No closed issues” — no resolved incidents in the selected time range.
Issue Card
Section titled “Issue Card”Each issue is displayed as an expandable card with Markdown rendering of the full incident report.
Card Header
Section titled “Card Header”| Element | Description |
|---|---|
| ID | Microsoft incident ID (e.g., EX1234567) |
| Affected Feature | Microsoft service/feature impacted (e.g., “Microsoft Teams”) |
| Severity | Incident (red/critical), Advisory (yellow/warning), or Other (grey/neutral) — shown as a colored chip |
| Classification | Type of issue (e.g., “Service degradation”) |
| Start Date | When the incident was first reported |
| End Date | (Closed issues only) When the incident was resolved |
Note: End times for closed issues are approximated (start time + 30 minutes) when Microsoft doesn’t provide an exact resolution timestamp.
Card Body (expandable)
Section titled “Card Body (expandable)”Click the issue title to expand and see:
- Full description of the scope and impact
- Affected services list
- Update timeline — Microsoft’s status updates during the incident lifecycle
- Remediation steps provided by Microsoft
The content is rendered as formatted Markdown directly from Microsoft’s service health feed.
Correlation Workflow
Section titled “Correlation Workflow”| Step | Action |
|---|---|
| 1 | Notice a quality drop on Home (Healthy Calls % drops) or Sites (NPA status changes) |
| 2 | Switch to the Issues tab — check “Current Issues” for active incidents |
| 3 | Compare the incident’s start time with the quality drop time |
| 4 | If they overlap → Microsoft-side issue. No need to change your local configuration. |
| 5 | If no matching incident exists → investigate the collector, network, or device-side issues |
Navigation
Section titled “Navigation”There is no drilldown from Issues to other pages. Use the top tab bar to navigate to Calls, Sites, or Users.
States
Section titled “States”| Situation | What you see |
|---|---|
| Loading | Loading skeleton cards |
| No current issues | ”No current issues” message |
| No closed issues in range | ”No closed issues” message |
| Data fetch error | Error alert in the relevant section |