Use the Dynatrace Dashboards
Data ingested by Dynatrace from the MS Teams collector can be used to build operational dashboards for call quality, user activity, site performance, and Microsoft incident correlation.
In addition to custom dashboards you can create in Dynatrace, ready-made dashboards are also available in the MS Teams Observability Dynatrace App repository:
microsoft-teams-observability-dynatrace-appDashboard names can vary slightly between app versions, but the analytical intent remains consistent.
Dashboard Examples
Section titled “Dashboard Examples”The following screenshots illustrate prebuilt dashboard examples.
Collection Health
Section titled “Collection Health”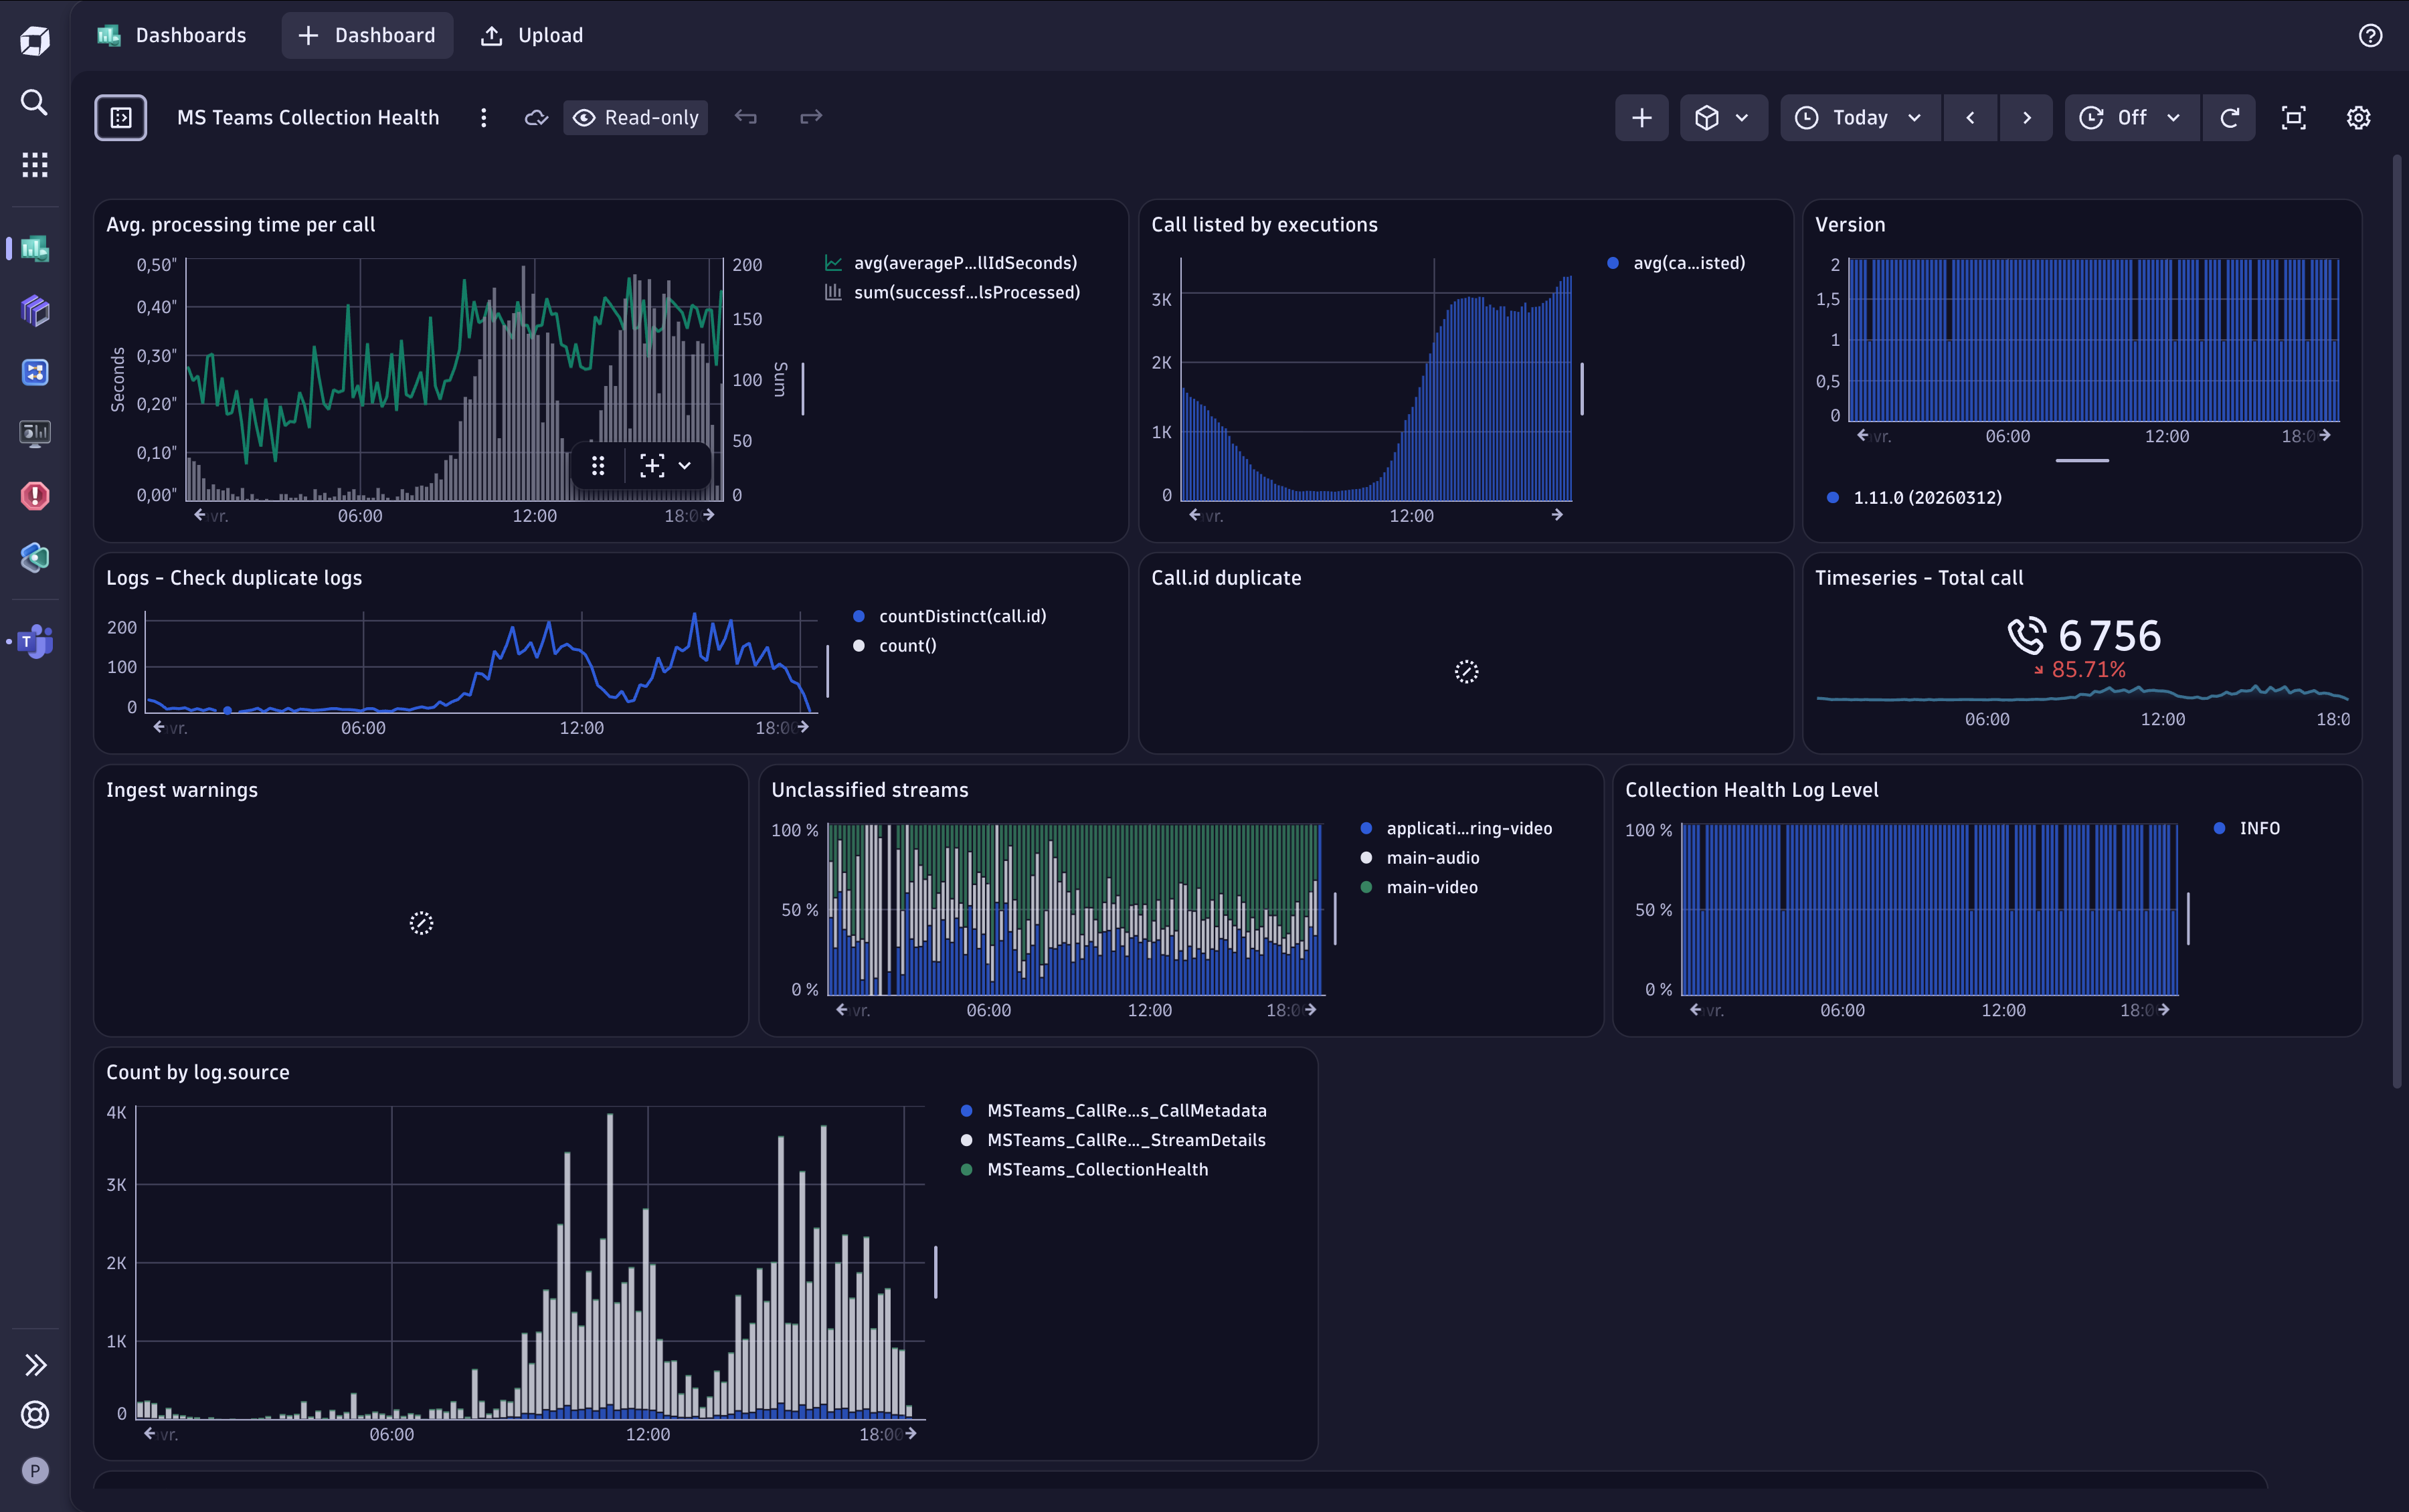
Call Analysis
Section titled “Call Analysis”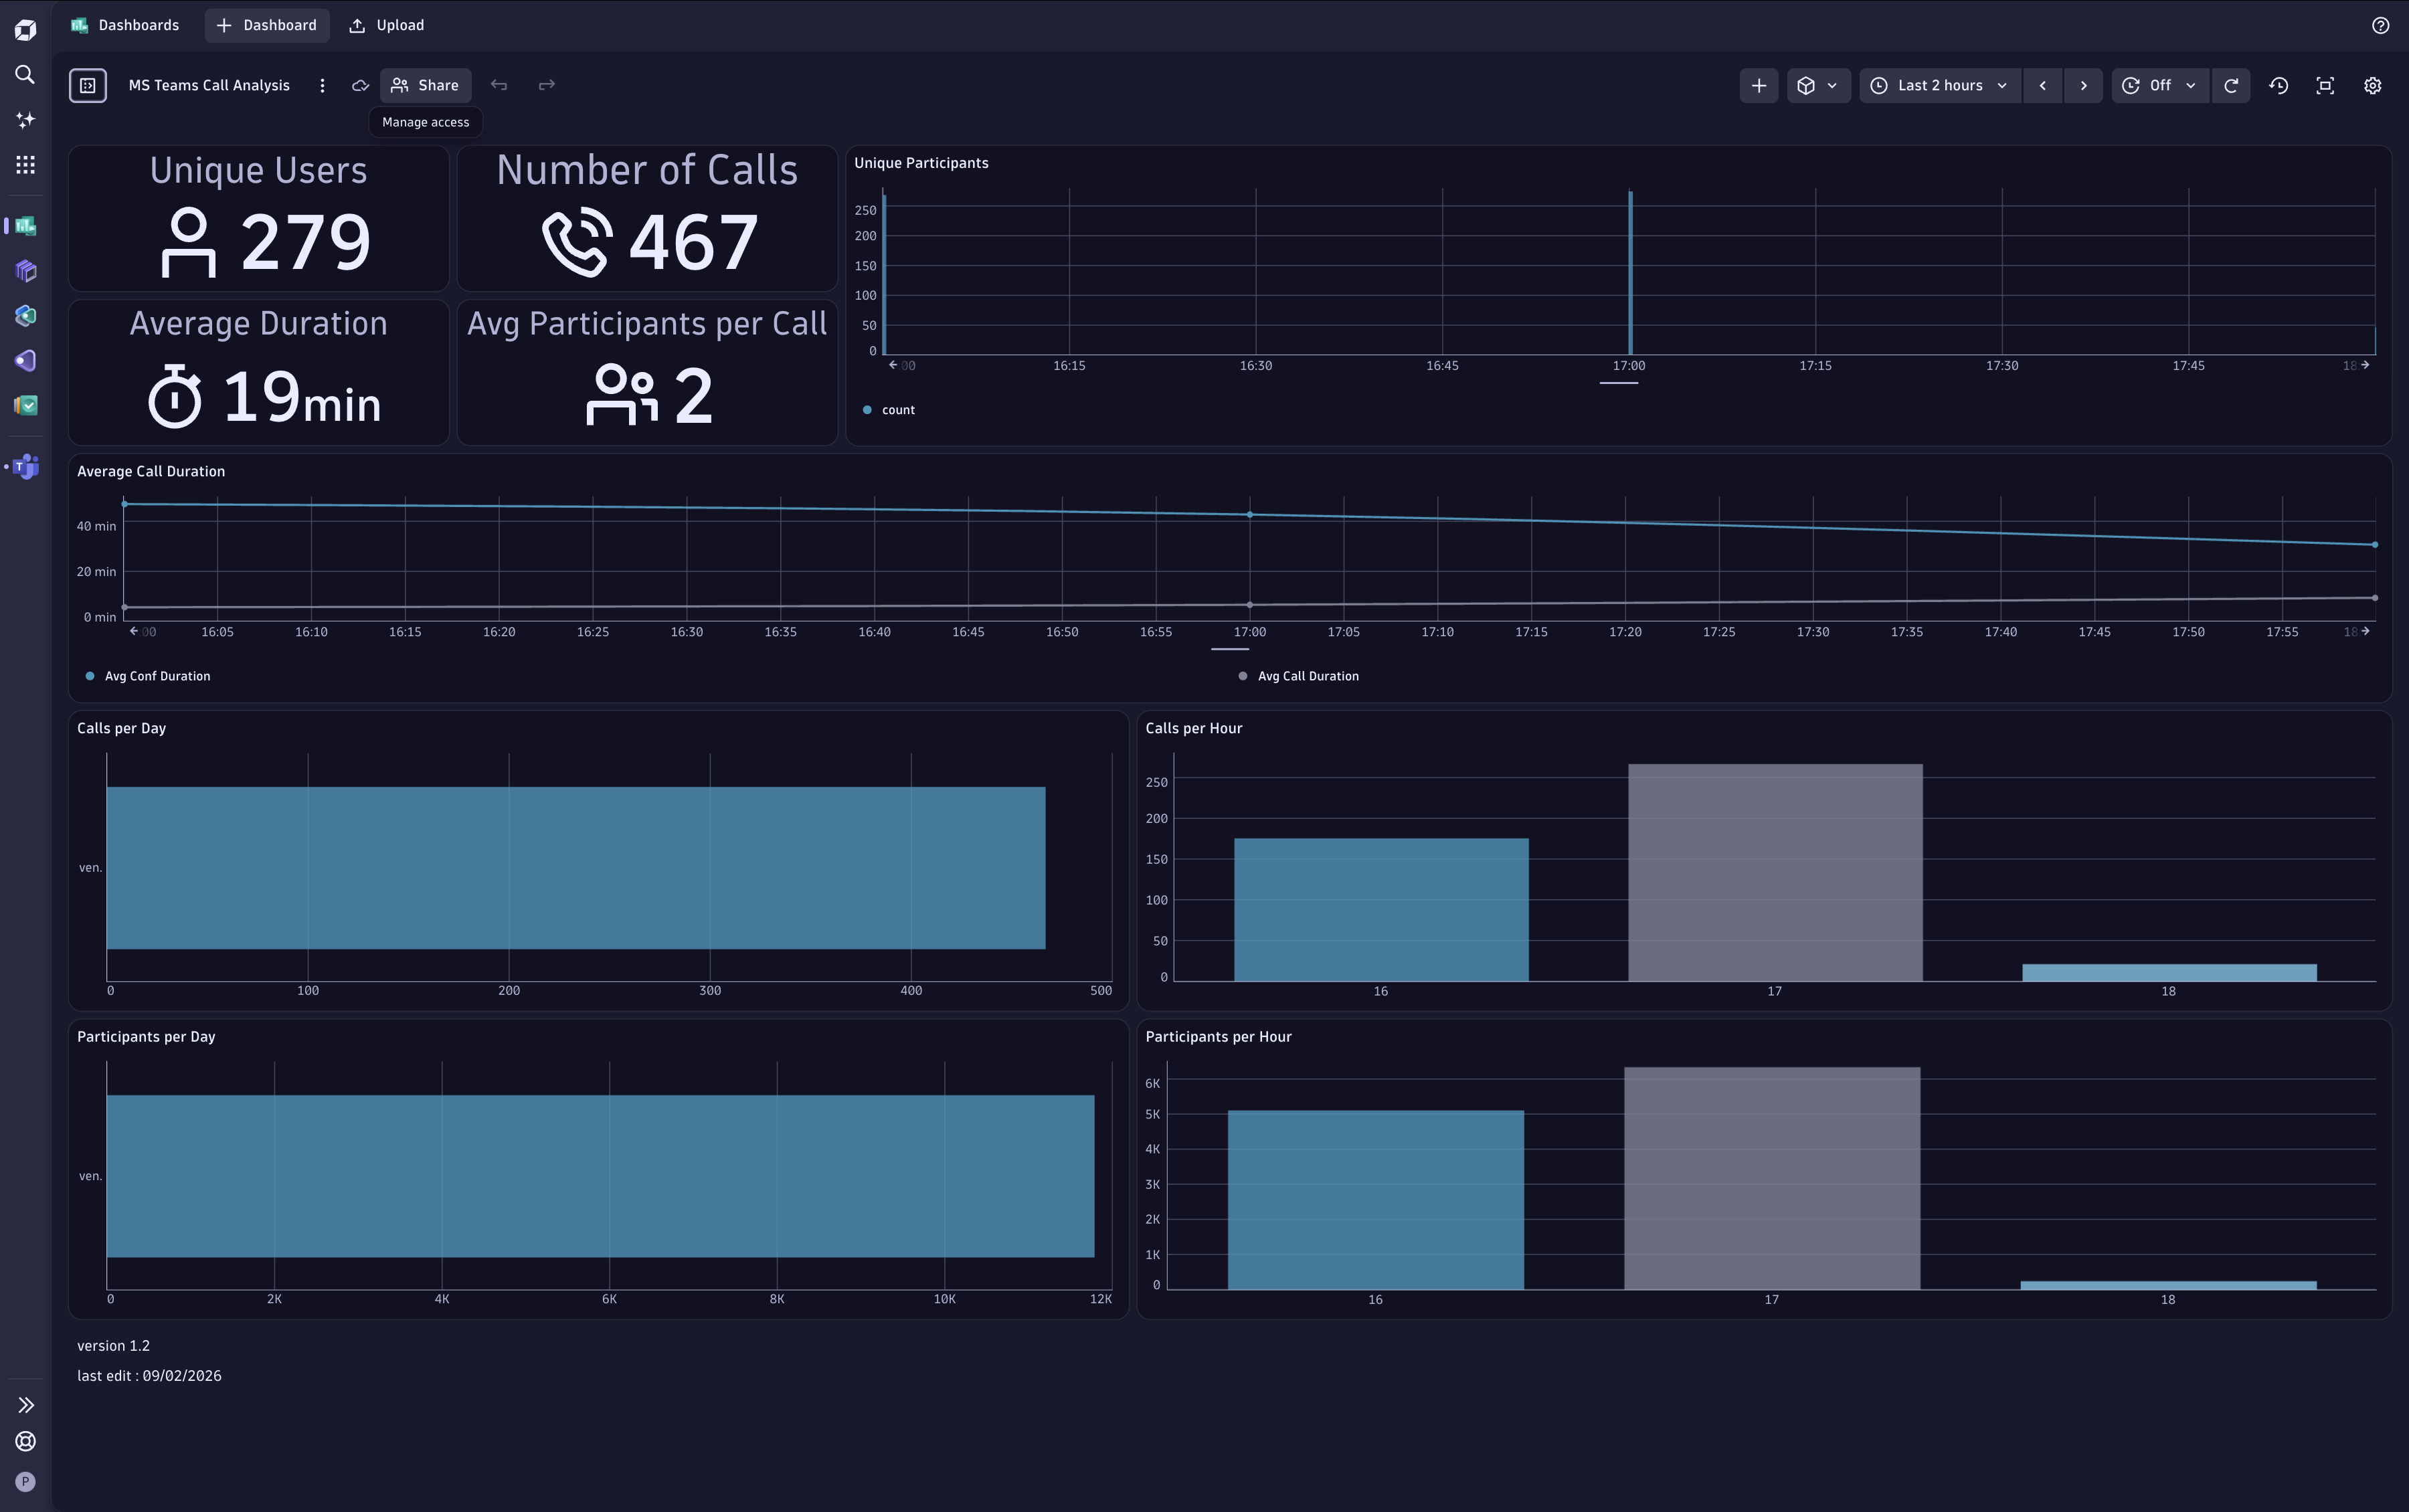
Devices & Versions Overview
Section titled “Devices & Versions Overview”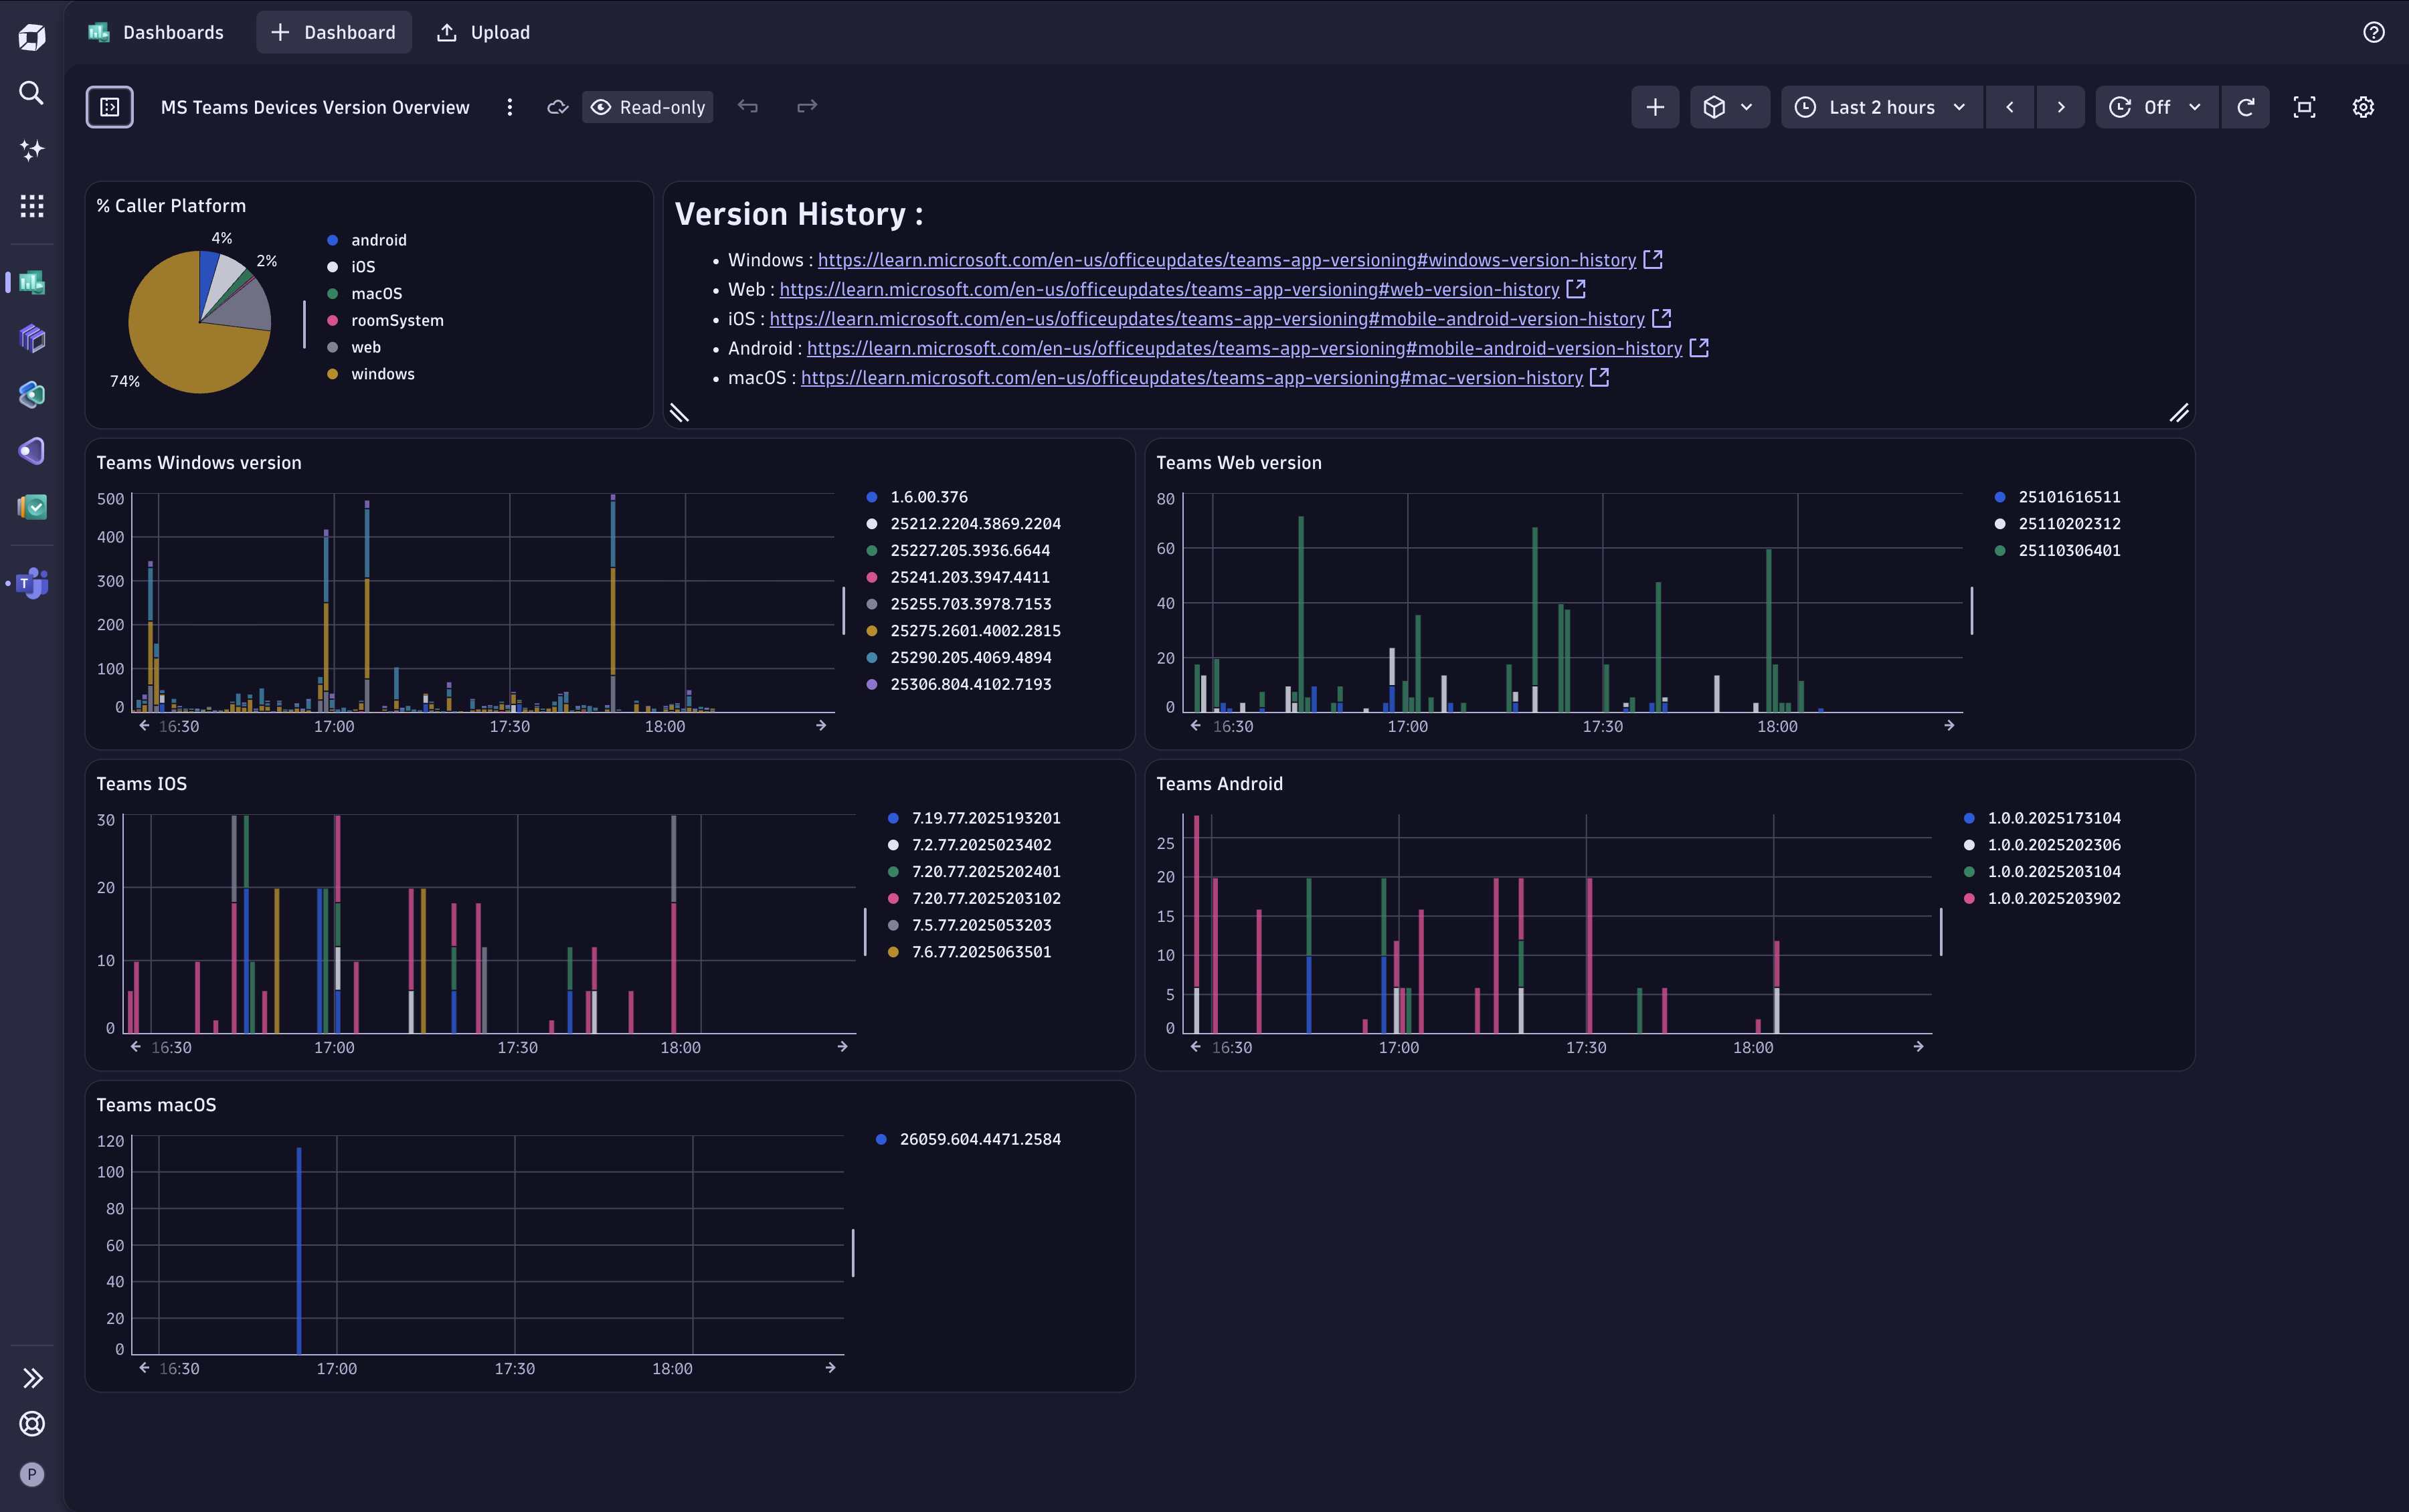
Best Practices
Section titled “Best Practices”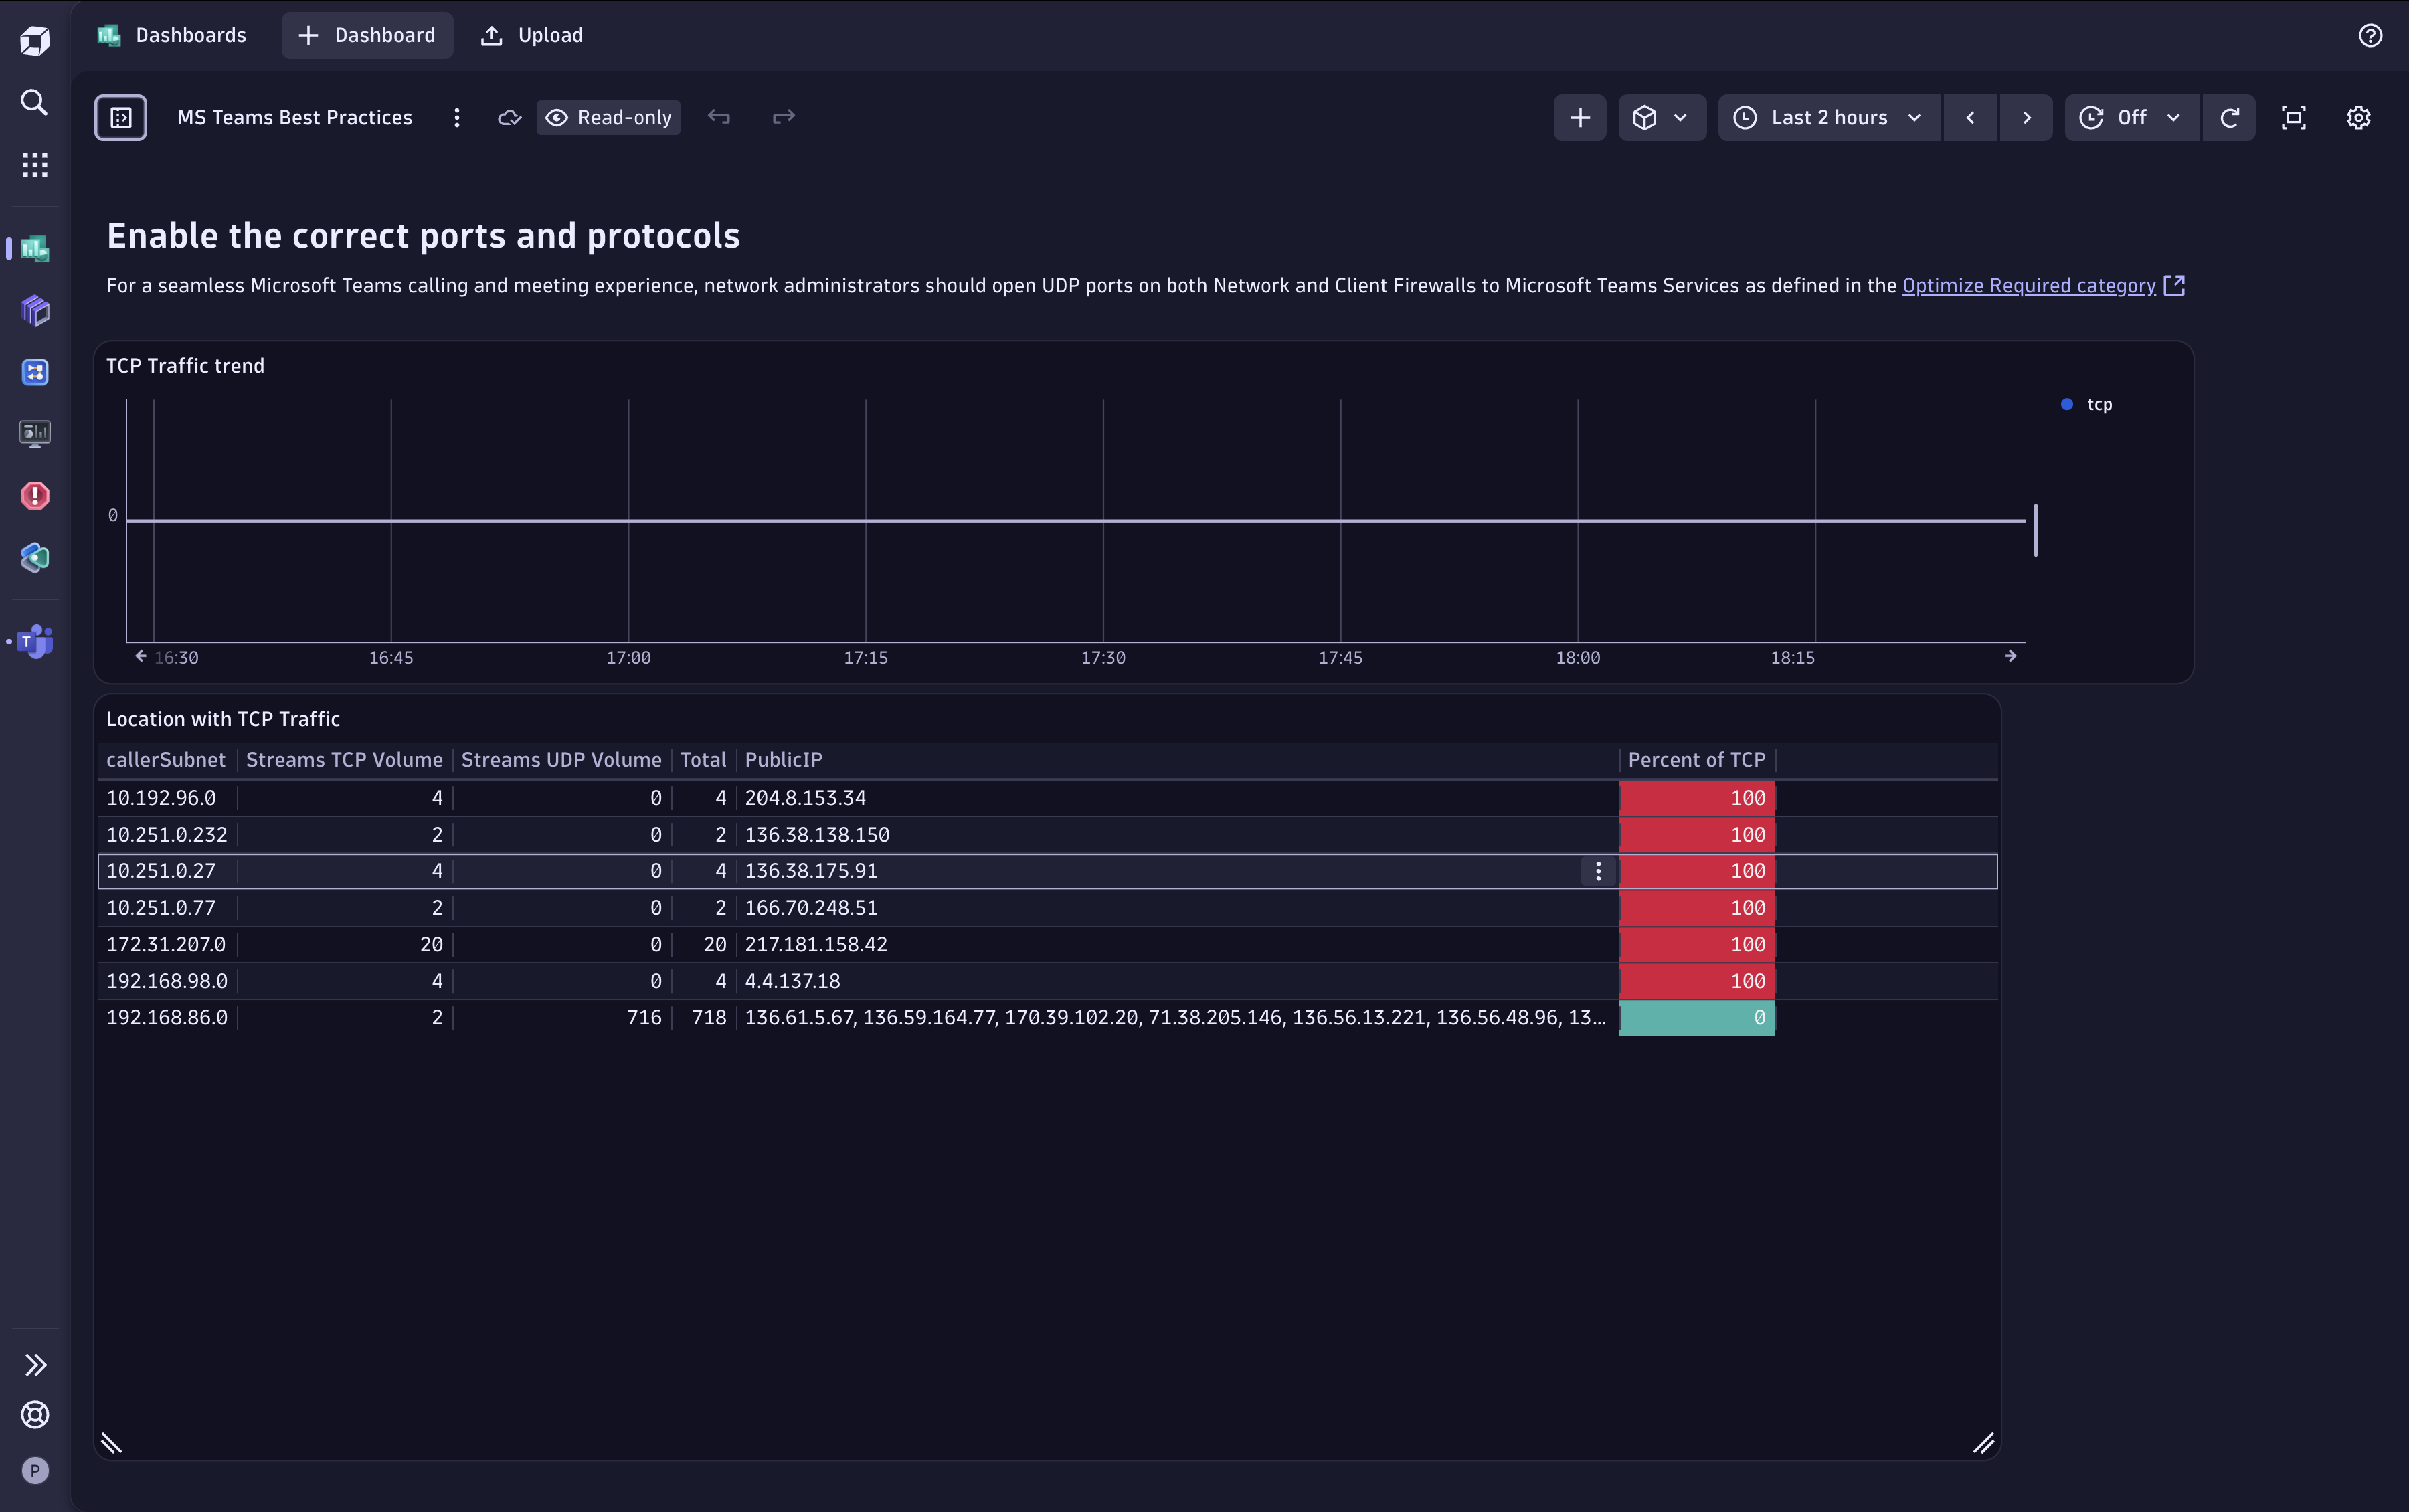
Recommended Dashboard Scope
Section titled “Recommended Dashboard Scope”When building or selecting dashboards, organize them by operational objective:
- Collection health: ingestion continuity, pipeline errors, and data freshness.
- Call analysis: call volume, health split, and quality degradation trends.
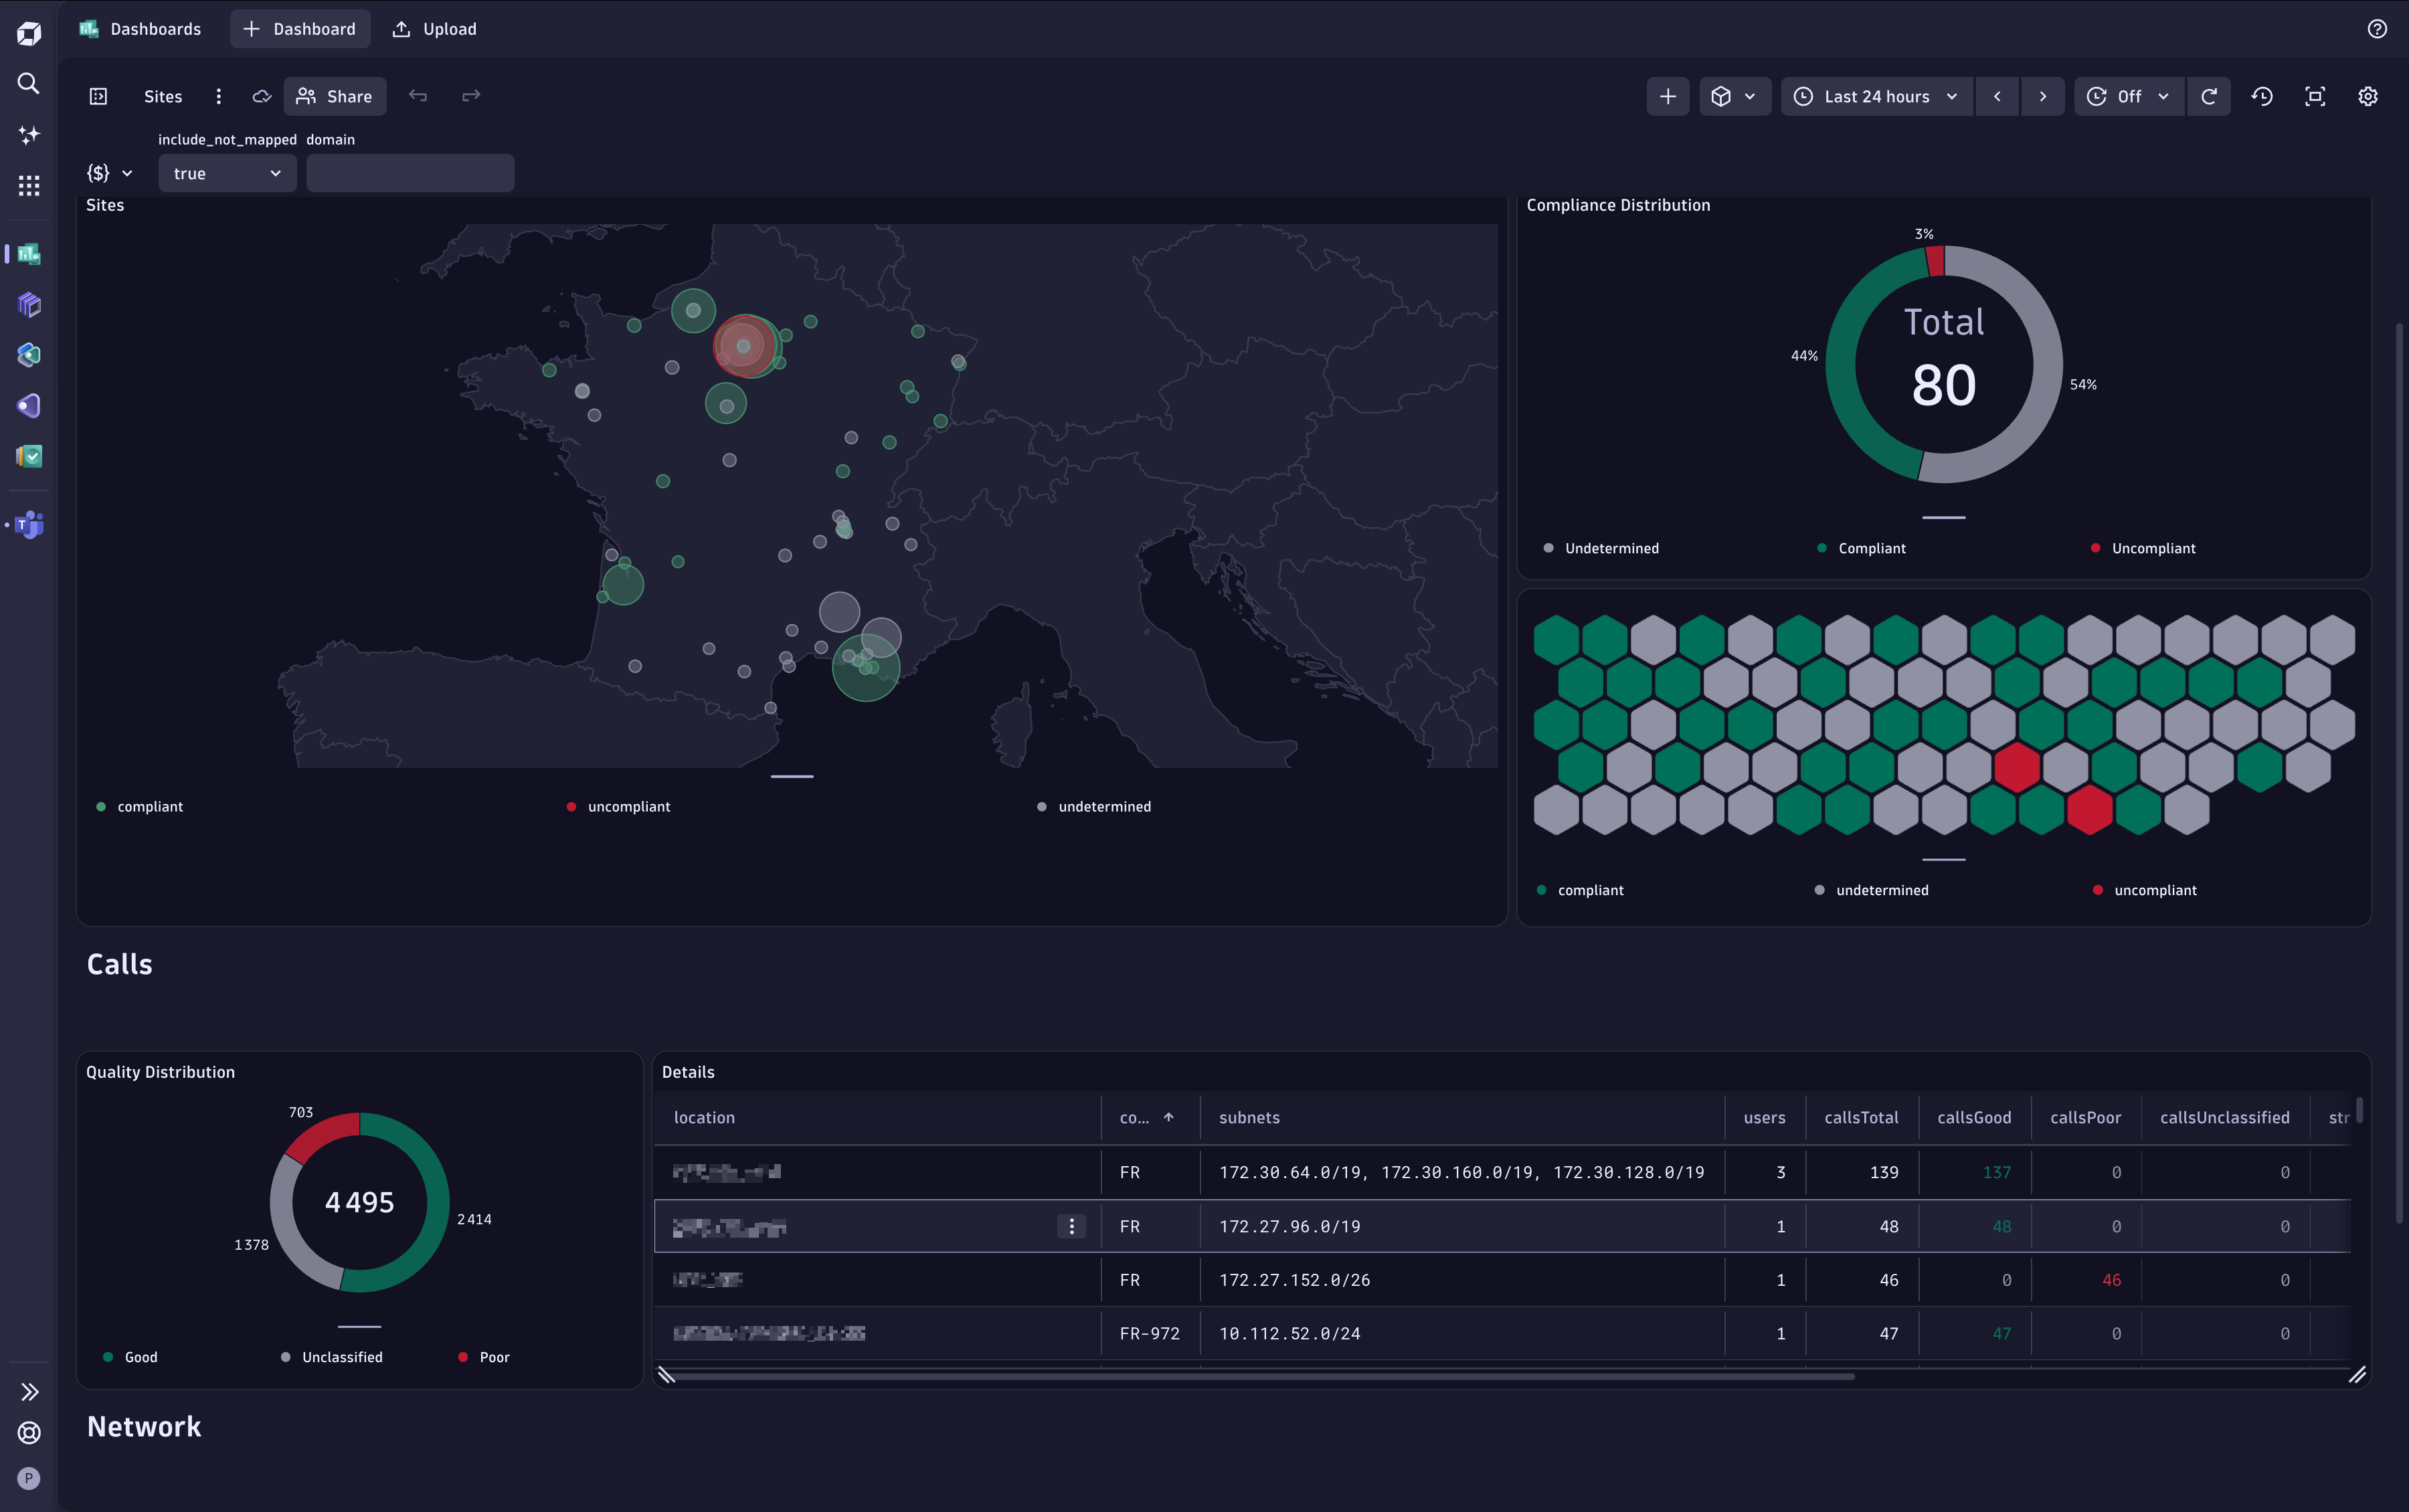
- Sites and networks: subnet/site quality and mapping coverage.
- Devices and versions: endpoint/OS/client-version distribution and drift.
- Operational best practices: governance checks and adoption indicators.
Related Documentation
Section titled “Related Documentation”This page focuses on Dynatrace dashboards built from ingested data.
If you are looking for the Dynatrace application pages (Home, Calls, Users, Issues, Configuration), see Explore the Dynatrace Application.