
Application — Calls
Tab label: Calls — Default time range: Last 6 hours
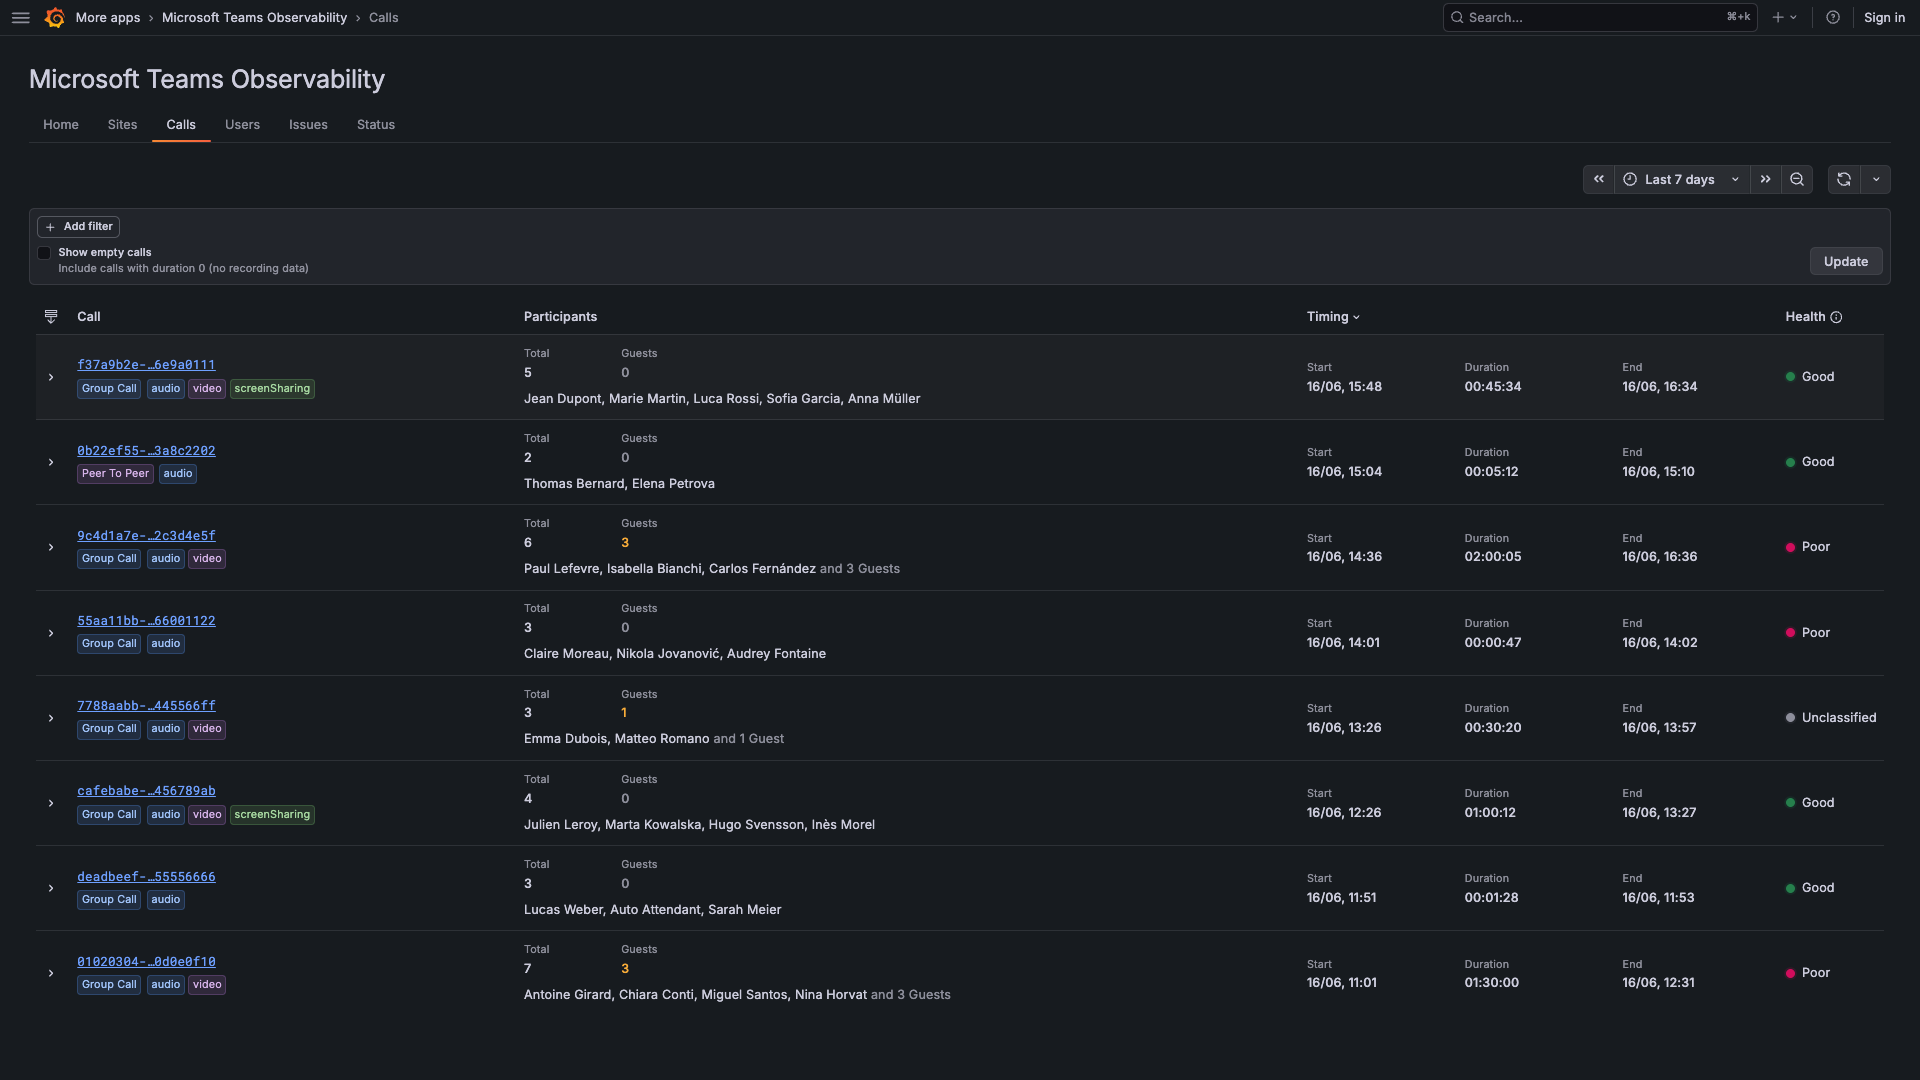
The Calls tab displays a filterable, sortable list of every call recorded by the collector. Use it to find specific calls, investigate quality issues, or drill down into a particular call’s full analysis.
Filters are chip-based using the key/operator/value pattern and are synced to the URL for bookmarkable queries.
Filter Bar
Section titled “Filter Bar”Chip Filters
Section titled “Chip Filters”Multiple filters can be combined. Each filter has three parts:
- Key: The call property to filter on
- Operator: Comparison operator
- Value: The filter value
Available filter keys
Section titled “Available filter keys”| Key | Display name | Type | Description | Available operators |
|---|---|---|---|---|
id | Id | String | Unique call identifier | =, !=, ~ (contains), starts with, ends with, in (), not in () |
participant | Participant | String | Name of any participant | =, !=, ~, starts with, ends with, in (), not in () |
participantCount | Participant Count | Number | Total number of participants | =, !=, >, >=, <, <= |
health | Health | Enum | Call quality status | =, !=, in (), not in () |
type | Type | Enum | Call topology | =, !=, in (), not in () |
start | Start | Date/Time | Call start timestamp | =, !=, >, >=, <, <= |
end | End | Date/Time | Call end timestamp | =, !=, >, >=, <, <= |
duration | Duration | Number (seconds) | Call duration | =, !=, >, >=, <, <= |
location | Location | String | Any participant’s site location | =, !=, ~, in (), not in () |
subnet | Subnet | String (CIDR) | Any participant’s network subnet | =, !=, ~, in (), not in () |
Valid values for health: Good, Poor, Unclassified
Valid values for type: peerToPeer (1:1 call), groupCall (3+ participants)
Duration suggestions (for quick filter entry):
| Label | Value (seconds) |
|---|---|
| 1 minute | 60 |
| 5 minutes | 300 |
| 10 minutes | 600 |
| 30 minutes | 1800 |
| 1 hour | 3600 |
| 2 hours | 7200 |
Show Empty Calls
Section titled “Show Empty Calls”A checkbox toggle. When checked, calls with a duration of 0 (no recording data) are included.
- Default: unchecked
- Stored in URL as
?showEmptyCalls=true
Update Button
Section titled “Update Button”Applies the current filter and showEmptyCalls setting. The button is highlighted when pending values differ from applied values. Disabled if filter syntax is invalid or a query is in progress.
Calls Table
Section titled “Calls Table”A sortable, paginated table listing all calls matching the current filters. Default sort: Start time descending (most recent first).
Columns
Section titled “Columns”| Column | Sortable | Description |
|---|---|---|
| Call | No | Call ID (clickable link to Call Overview), call type chip (peerToPeer = purple, group = blue), and modality badges (Audio = blue, Video = purple, Screen Share = green) |
| Participants | By first name | Participant count (total + guests count). Guest count shown with a warning tone if > 0. Participant names listed (guests summarized as “and N Guest(s)”). |
| Timing | By start time | Start timestamp, Duration (HH:MM:SS), End timestamp |
| Health | By rank | Colored badge: Good (green), Poor (red), Unclassified (grey). Sort order: Good → Poor → Unclassified. |
Call ID Column details
Section titled “Call ID Column details”The Call ID is a clickable link to the Call Overview drilldown. The link includes a 10-minute padding before the start and after the end. The time range from the Calls page is preserved (parentFrom/parentTo URL parameters).
Participants Column details
Section titled “Participants Column details”- Named participants listed comma-separated in a compact view.
- Guests are counted separately and shown with a warning indicator.
- Hover shows the full participant list.
Call Overview Drilldown
Section titled “Call Overview Drilldown”Clicking any Call ID opens the Call Overview as a drilldown page. See the dedicated Call Overview page for the full list of panels:
- Verdict header — call ID, timestamps, duration, organizer, KPI row
- Call Map — geographic view of participant locations
- Call Details Panel — participant table with network info
- Evidence Panel — stream quality classification with metric/value/threshold
- Streams Table — per-stream metrics (RTT, jitter, packet loss, codec)
- Call Timeline — stream overlap visualization
- IP Insights — ASN distribution, shared IPs, relay, private IPs
- Network Path — hop-by-hop traceroute data
- Network IP Inventory — all IPs per participant
- Device Endpoint Matrix — platform, host, audio signals, client version
- Bot Activity — conditional, only if bots participated
URL Parameters
Section titled “URL Parameters”| Parameter | Description | Example |
|---|---|---|
filter | Chip-based filter expression (JSON-encoded) | [{"key":"health","operator":"=","value":"Poor"}] |
showEmptyCalls | Include calls with no recording | true / false |
from | Timeframe start | now()-6h |
to | Timeframe end | now() |
parentFrom / parentTo | Time range from parent page (preserved on back navigation) | now-7d / now() |
Empty / Error States
Section titled “Empty / Error States”| Situation | What you see |
|---|---|
| Loading (no data yet) | LoadingPlaceholder message |
| No calls match filters | Empty table with headers visible |
| Filter syntax invalid | Update button disabled |
| Network error | Error alert with message |
| No datasource configured | Error message in the table area |
Navigation from this page
Section titled “Navigation from this page”| Action | Destination |
|---|---|
| Click a Call ID | Call Overview for that call |
| Navigated from Users page | Filter pre-populated with the selected user’s name |
| Navigated from Sites table | Filter pre-populated with the selected location |
| Browser back | Returns to the previous page (Users or Sites) with the same time range |