
Application — Home
Tab label: Home — Default time range: Last 7 days
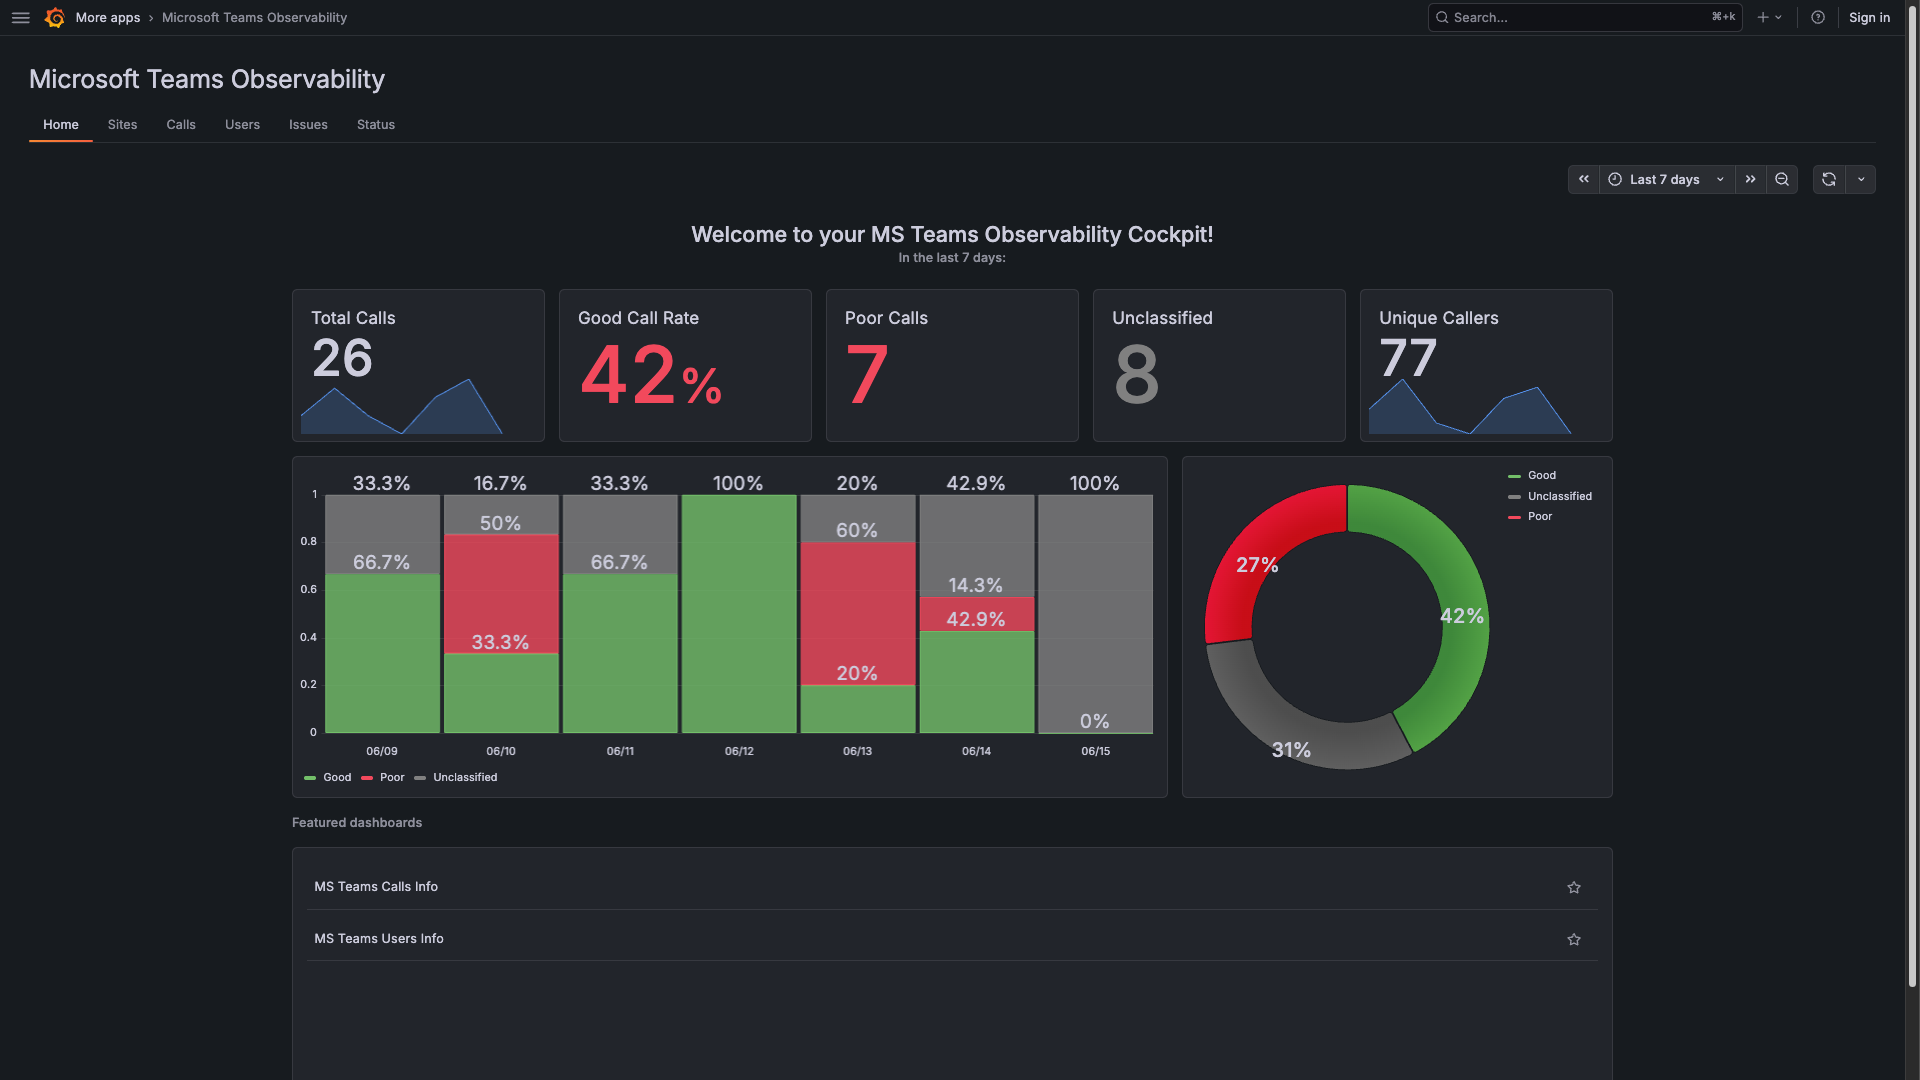
The Home page is the landing tab of the MS Teams Observability app. It provides a high-level summary of your Teams calling activity — use it as a daily health check before diving into details on other pages.
The time range is adjustable via the Grafana time picker (top right). All KPIs and charts recompute when the range changes.
KPI Cards
Section titled “KPI Cards”Three key performance indicators at the top of the page:
| KPI | Description | Interpretation |
|---|---|---|
| Total Calls | Number of MS Teams calls in the selected time range | Compare day-over-day. A sudden drop may indicate collection issues. |
| Healthy Calls % | Percentage of calls classified as Good (all streams within quality thresholds) | Above 95%: excellent. 80-95%: acceptable. Below 80%: investigate on Sites or Calls. |
| Unique Callers | Number of distinct users who made or received calls | Watch for trends — declining callers may indicate user adoption issues. |
Charts
Section titled “Charts”Call Health Distribution
Section titled “Call Health Distribution”A stacked bar or donut chart showing the proportion of Good, Poor, and Unclassified calls.
| Segment | Color | Meaning |
|---|---|---|
| Good | Green | All streams within quality thresholds |
| Poor | Red | At least one stream exceeded a quality threshold |
| Unclassified | Grey | Insufficient telemetry data to classify |
Use this chart to spot quality degradation at a glance over time.
Platform Distribution
Section titled “Platform Distribution”A pie chart or bar chart showing calls broken down by participant platform:
| Slice | Color | Platform |
|---|---|---|
| Windows | Blue | Windows desktop client |
| macOS | Light blue | macOS desktop client |
| iOS | Purple | iPhone/iPad app |
| Android | Green | Android app |
| Web | Orange | Browser-based Teams client |
| Unknown | Grey | Platform could not be determined |
How It Works
Section titled “How It Works”The Home page queries the Loki datasource using the configured data provider:
- Live mode: Data comes from the Loki datasource specified in Provisioning
- Demo mode: Data comes from built-in JSON fixtures in
src/data/
All metrics are recomputed when the time range changes.
States
Section titled “States”| Situation | What you see |
|---|---|
| Loading (first time) | Loading spinner in each card/chart |
| Loading (time range change) | Previous data fades while new data loads |
| No data | Charts show empty state with “No data” message |
| Network error | Error alert in the relevant section |
| Data loaded | All KPIs and charts rendered normally |
URL Parameters
Section titled “URL Parameters”| Parameter | Description | Example |
|---|---|---|
from | Time range start | now-7d |
to | Time range end | now() |