
Application — Sites
Tab label: Sites — Default time range: Last 2 hours
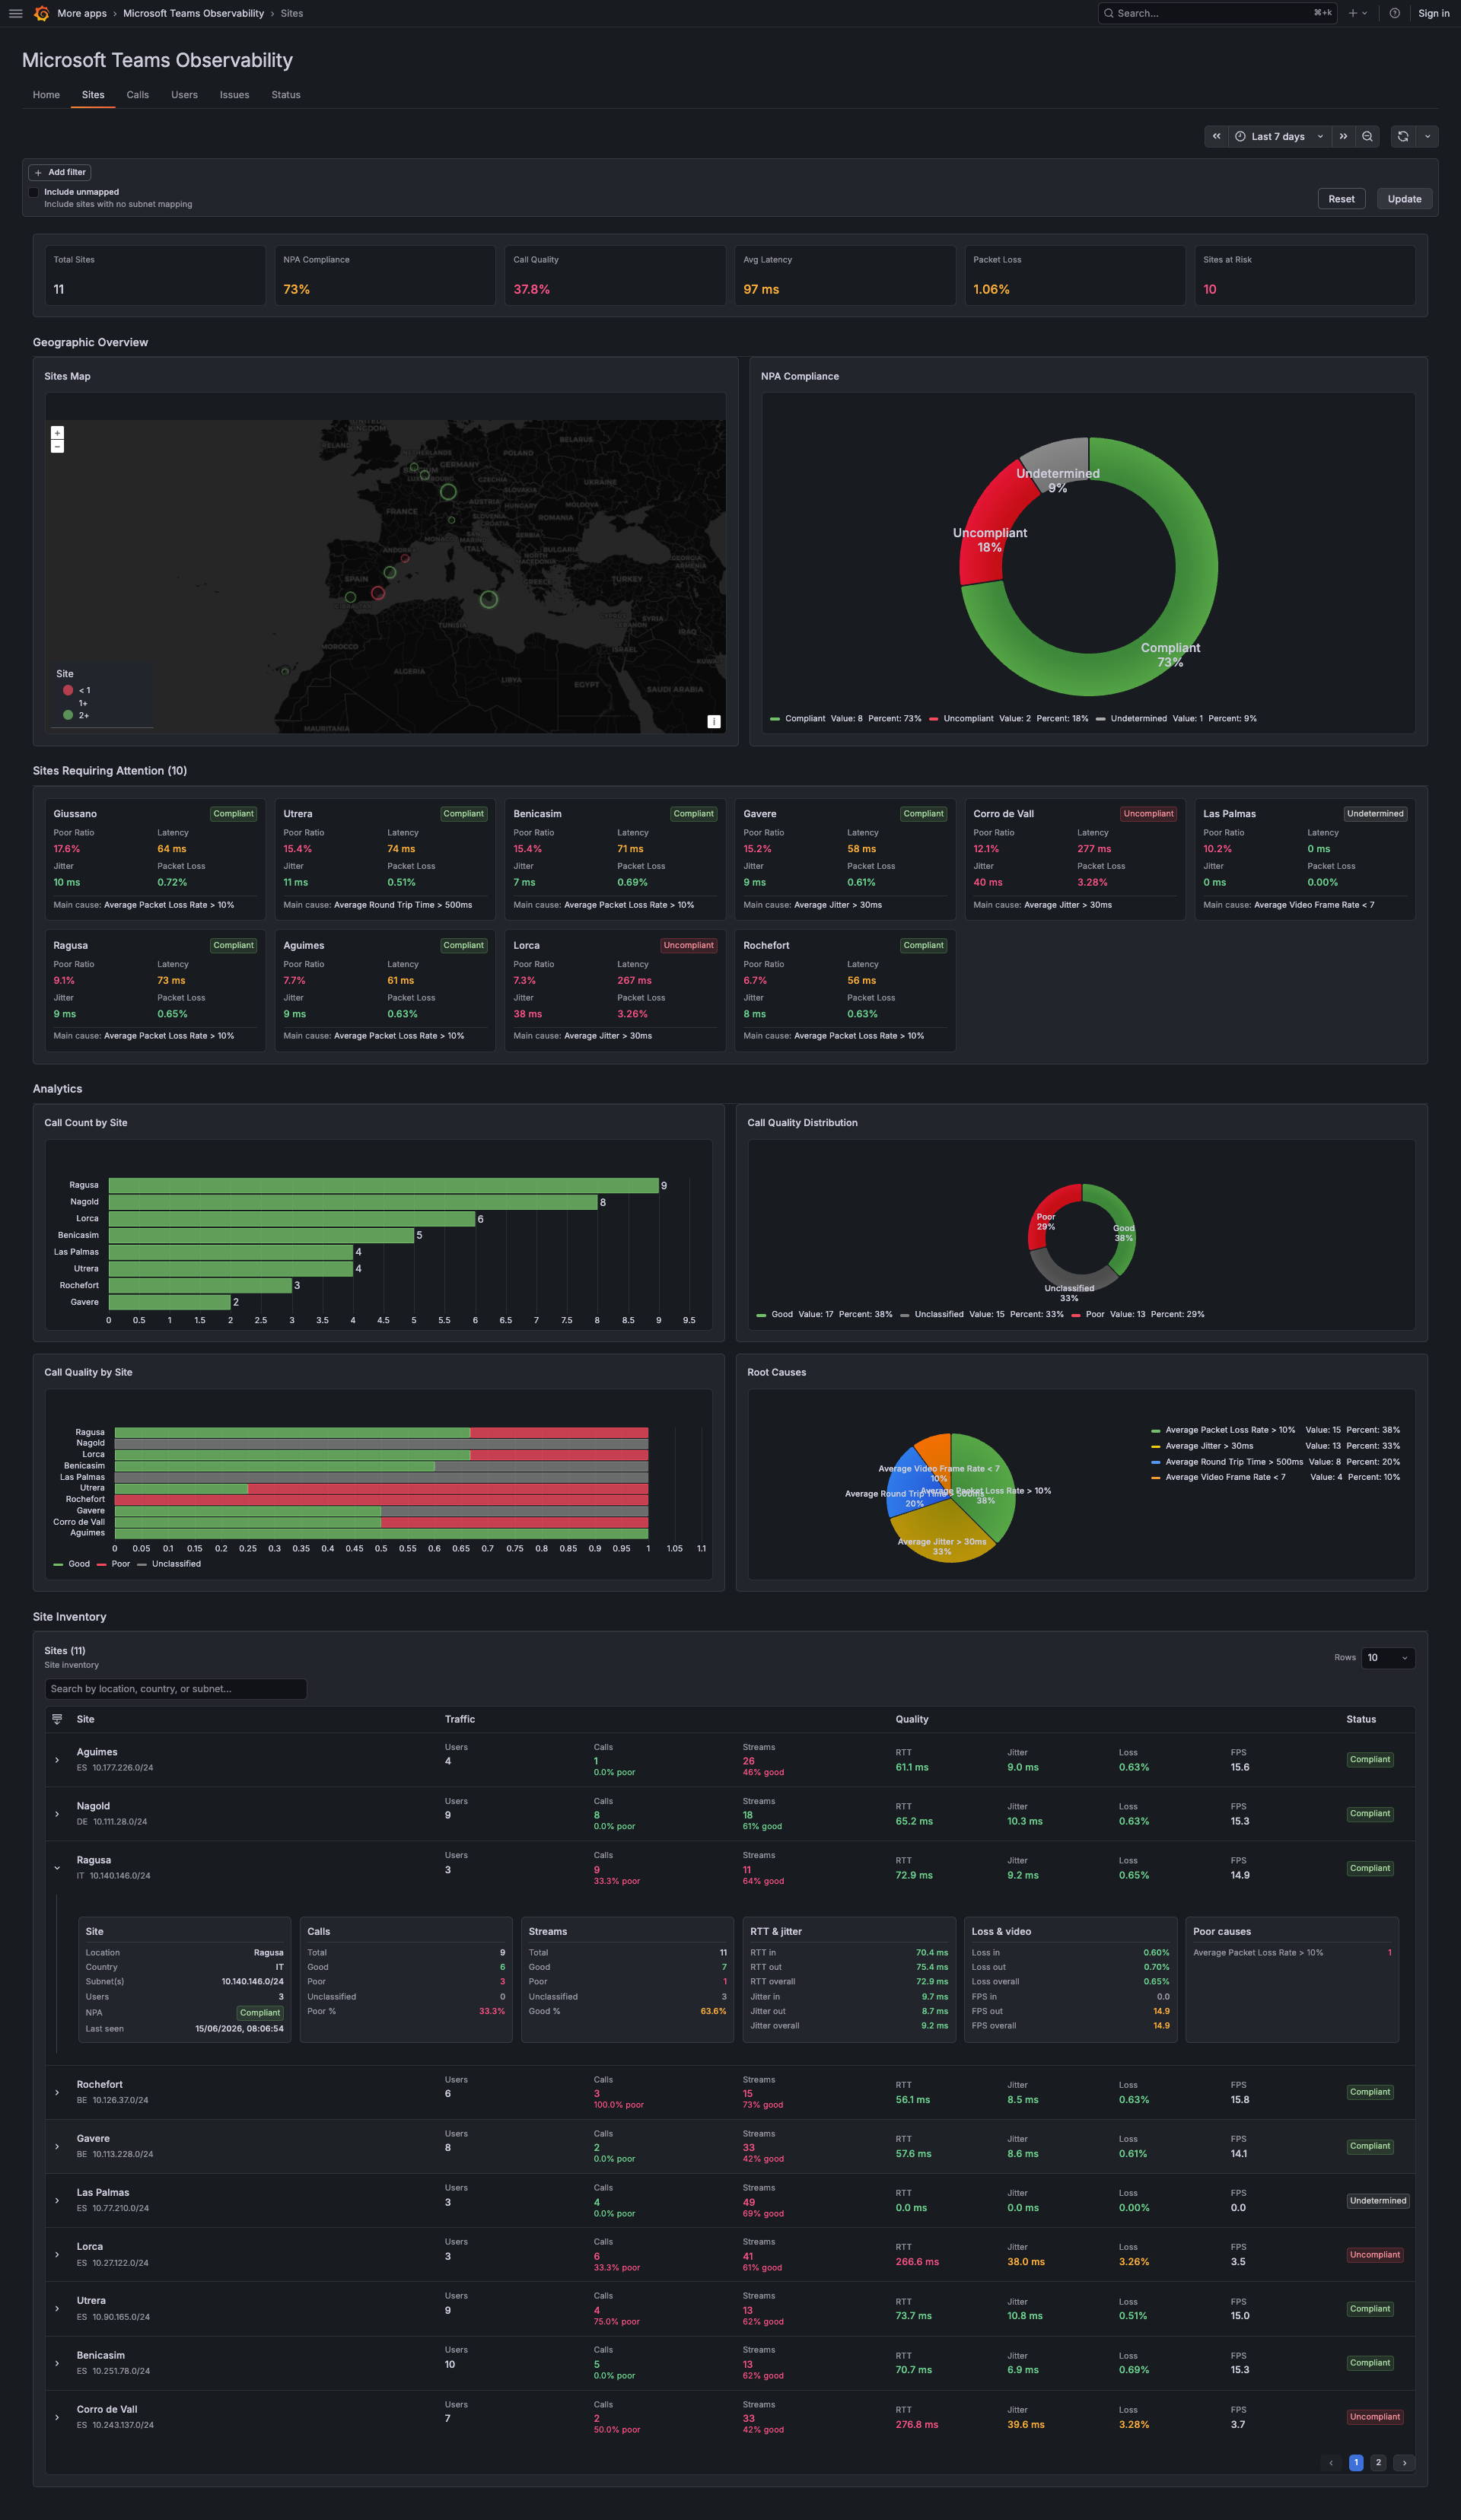
The Sites tab aggregates call quality by geographic location using your subnet-to-location CSV mapping. Each site represents a named location (office, campus, datacenter) associated with one or more network subnets.
Sites are defined in your subnet location CSV uploaded in Provisioning. Keep it up to date for accurate analytics.
Filter Bar
Section titled “Filter Bar”A chip-based filter bar with the key/operator/value pattern, synced to the URL (?filter=...).
Available filter keys
Section titled “Available filter keys”| Key | Type | Operators | Description |
|---|---|---|---|
location | String | =, !=, ~, !~, in (), not in () | Site location name |
country | String | =, !=, ~, !~, in (), not in () | Country code or name |
subnet | CIDR | =, !=, ~, !~, in (), not in () | Network subnet (e.g., 10.64.0.0/24) |
npaStatus | Enum | =, !=, in (), not in () | NPA compliance status |
callCount | Number | =, !=, >, >=, <, <= | Total number of calls |
goodCallCount | Number | Same | Number of good calls |
poorCallCount | Number | Same | Number of poor calls |
unclassifiedCallCount | Number | Same | Number of unclassified calls |
streamCount | Number | Same | Total number of audio/video streams |
goodStreamCount | Number | Same | Number of good streams |
poorStreamCount | Number | Same | Number of poor streams |
unclassifiedStreamCount | Number | Same | Number of unclassified streams |
usersCount | Number | Same | Total unique users |
jitterIn / jitterOut / jitterOverall | Number (ms) | Same | Jitter values |
rttIn / rttOut / rttOverall | Number (ms) | Same | Round-trip time |
packetLossIn / packetLossOut / packetLossOverall | Number (%) | Same | Packet loss |
videoFramerateIn / videoFramerateOut / videoFramerateOverall | Number (fps) | Same | Video framerate |
Valid values for npaStatus: compliant, uncompliant, undetermined
Include Unmapped Subnets
Section titled “Include Unmapped Subnets”A toggle checkbox to include or exclude calls from IPs not assigned to any site.
- Checked (default): Unmapped subnets are included as a single “Unmapped” entry
- Unchecked: Only sites with a subnet mapping are shown
Stored in URL as ?includeUnmapped=true/false.
Update Button
Section titled “Update Button”Applies the current filter and include-unmapped setting. Highlighted when pending values differ from applied values.
Header KPIs
Section titled “Header KPIs”Six summary cards at the top of the page, color-coded by performance thresholds:
| KPI | Description | Color coding |
|---|---|---|
| Total Sites | Number of sites in your configuration | Neutral |
| NPA Compliance | Percentage of sites meeting Microsoft’s network quality thresholds | Green ≥ 90%, Yellow ≥ 80%, Red < 80% |
| Call Quality | Overall good call percentage across all sites | Green ≥ 95%, Yellow ≥ 80%, Red < 80% |
| Avg Latency | Average round-trip time across all sites (ms) | Green < 100ms, Yellow < 200ms, Red ≥ 200ms |
| Packet Loss | Average packet loss across sites (%) | Green < 1%, Yellow < 5%, Red ≥ 5% |
| Sites at Risk | Count of sites with poor quality trends | Color-coded: 0 = green, 1-3 = yellow, 4+ = red |
Geographic Overview
Section titled “Geographic Overview”Sites Map
Section titled “Sites Map”A geographic map panel with site location markers. Each marker is color-coded by NPA status:
| Color | Status | Meaning |
|---|---|---|
| Green | Compliant | Site meets Microsoft’s network quality thresholds |
| Red | Uncompliant | Site does not meet thresholds |
| Grey | Undetermined | Not enough data to classify |
NPA Compliance Donut
Section titled “NPA Compliance Donut”A donut/ring chart showing the proportion of sites in each NPA status:
| Segment | Meaning |
|---|---|
| Compliant (green) | Site passes all quality thresholds |
| Uncompliant (red) | Site fails one or more thresholds |
| Undetermined (grey) | Insufficient data |
NPA Thresholds
Section titled “NPA Thresholds”A site is classified as uncompliant if any of these conditions are met:
| Metric | Threshold |
|---|---|
| Average Jitter | ≥ 30 ms |
| Average RTT (Latency) | ≥ 200 ms |
| Average Packet Loss | ≥ 2% |
| TCP Ratio | ≥ 1% of streams using TCP |
Sites Requiring Attention
Section titled “Sites Requiring Attention”A table showing sites that need investigation. A site is flagged as “at risk” if:
- Its NPA status is uncompliant, OR
- More than 5% of its streams are Poor
| Column | Description |
|---|---|
| Location | Site name |
| NPA Status | Compliant / Uncompliant / Undetermined |
| Call Count | Total calls |
| Poor Stream % | Percentage of poor streams (highlighted if > 5%) |
| Key Issues | Summary of the main quality issue(s) detected |
Analytics
Section titled “Analytics”Four charts providing deeper insight into site performance:
| Chart | Type | Description |
|---|---|---|
| Call Count by Site | Horizontal bar (top 8) | Which sites generate the most calls |
| Call Quality Distribution | Donut chart | Overall good/poor/unclassified ratio across all sites |
| Call Quality by Site | Stacked bar (top 10) | Per-site breakdown of good/poor/unclassified calls |
| Root Causes | Pie chart | Breakdown of root causes for poor calls (e.g., packet loss, jitter, latency) |
Site Inventory
Section titled “Site Inventory”A full-featured table listing all sites with detailed metrics:
| Column | Sortable | Description |
|---|---|---|
| Location | Yes | Site name. Clicking navigates to Calls pre-filtered for that location. |
| Country | Yes | Country associated with the site |
| Call Count (Total / Good / Poor / Unclassified) | Yes | Call volume breakdown |
| Stream Count (Total / Good / Poor / Unclassified / Ratio) | Yes | Stream volume and poor ratio |
| Users | Yes | Unique user count |
| NPA Status | Yes | Compliant (green), Uncompliant (red), Undetermined (grey) — row is color-coded accordingly |
| Avg Latency | Yes | Average RTT in ms |
| Avg Jitter | Yes | Average jitter in ms |
| Avg Packet Loss | Yes | Average packet loss % |
| Video Framerate | Yes | Average video framerate |
Row actions: Hover shows an external link icon → navigates to Calls filtered by that location.
URL Parameters
Section titled “URL Parameters”| Parameter | Description | Example |
|---|---|---|
filter | Chip-based filter expression (JSON-encoded) | [{"key":"npaStatus","operator":"=","value":"uncompliant"}] |
includeUnmapped | Include unmapped subnets | true / false |
from | Timeframe start | now()-2h |
to | Timeframe end | now() |
Empty / Error States
Section titled “Empty / Error States”| Situation | What you see |
|---|---|
| Loading | Loading spinners in each section |
| No sites match filters | ”No sites match the selected time range and filters.” |
| No sites configured at all | Empty inventory table with a message to configure subnets in Provisioning |
| Network error | Error alert at the top of the page |