
Application — Overview
The MS Teams Observability app is installed in your Grafana environment and provides operational visibility into your Microsoft Teams estate. It queries Loki logs exported by the collector.
Developed by: Phenisys | Platform: Grafana Plugin
Screenshots
Section titled “Screenshots”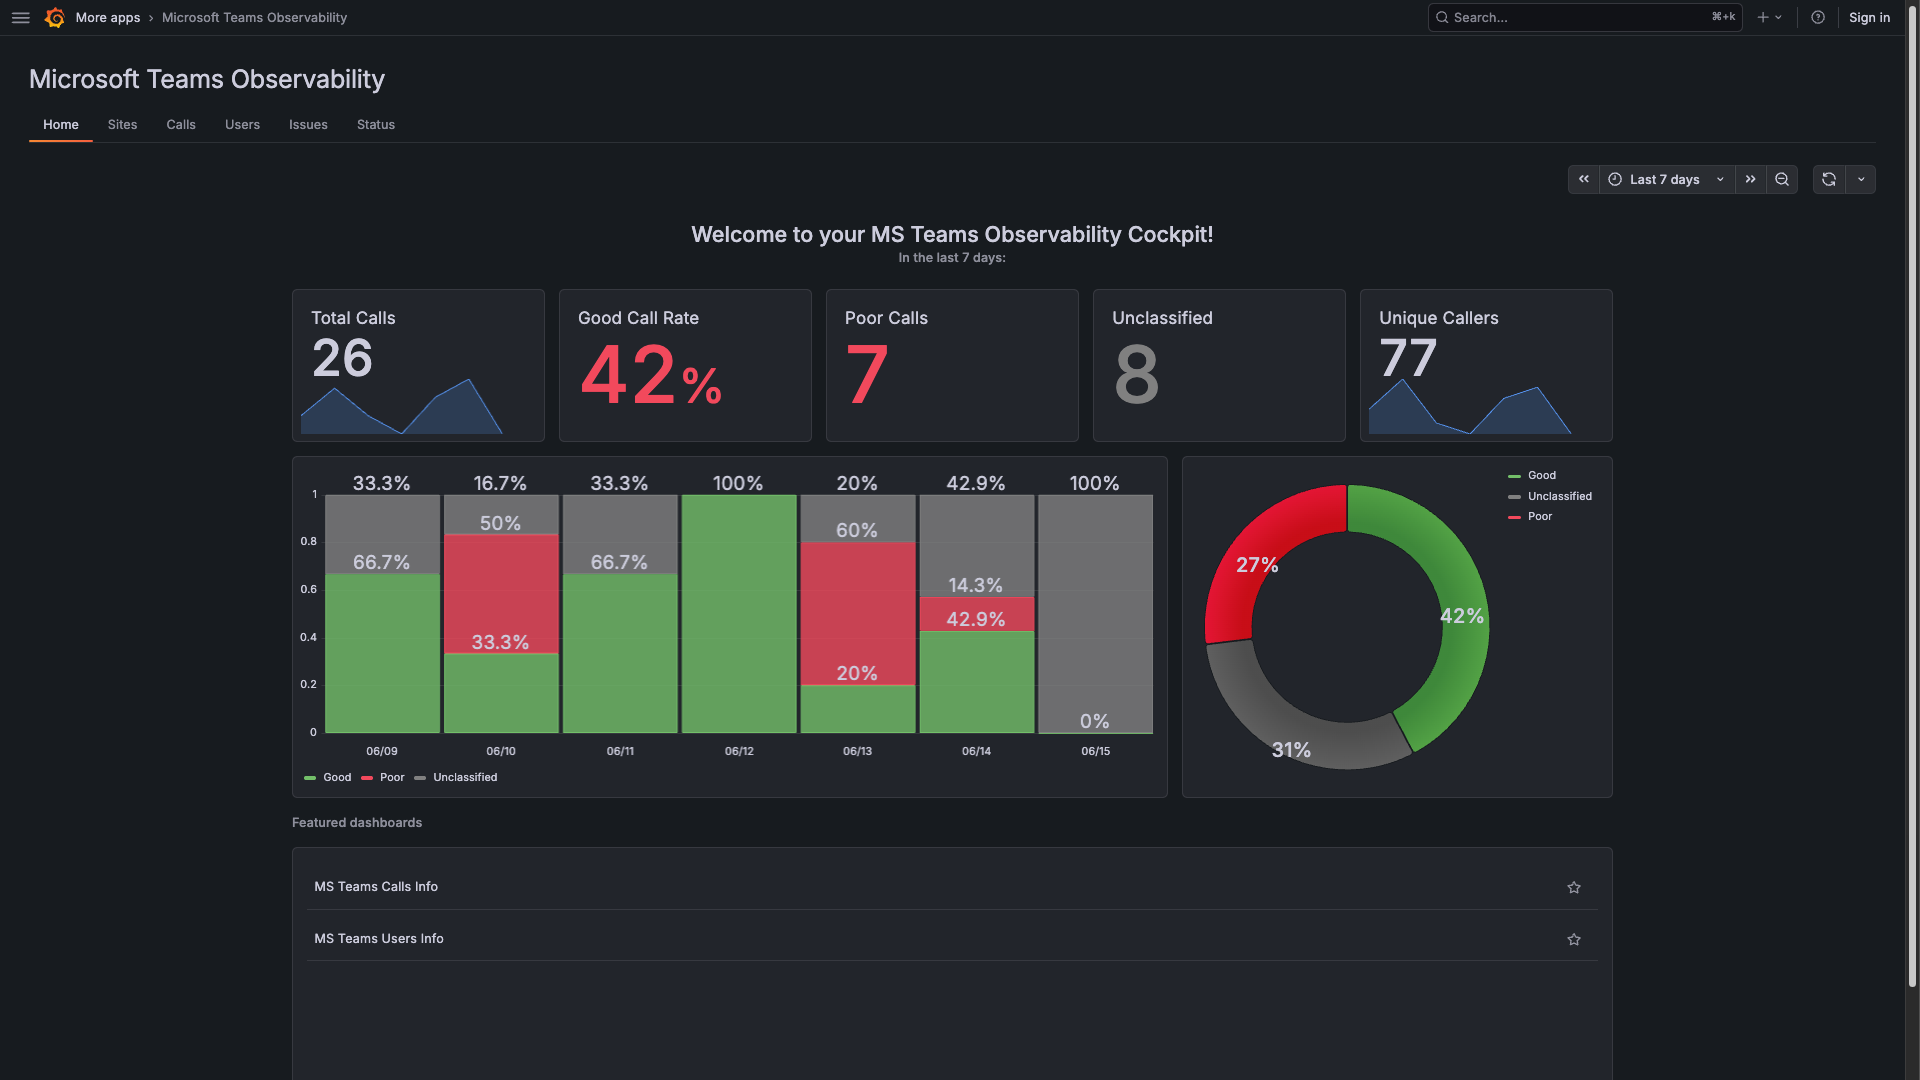
Navigation
Section titled “Navigation”The app has 6 tabs in the top navigation bar:
| Tab | Route | Description |
|---|---|---|
| Home | /home | Cockpit overview: KPIs, call health, platform distribution |
| Sites | /sites | Quality by location: geomap, NPA compliance, analytics |
| Calls | /calls | Filterable call list — click a call to drill into Call Overview |
| Users | /users | Per-user analytics: calls, devices, network, recent calls |
| Issues | /issues | Microsoft 365 service health incidents |
| Status | /configuration | License, feature status, outgoing connection tests |
Installation Install the plugin from the Grafana Plugin Catalog.
Home KPI cards (call count, healthy-calls %, caller count) and quality charts.
Sites Geomap, NPA compliance, analytics charts, and site inventory.
Calls Key/op/value filter bar, sortable table, drilldown to Call Overview.
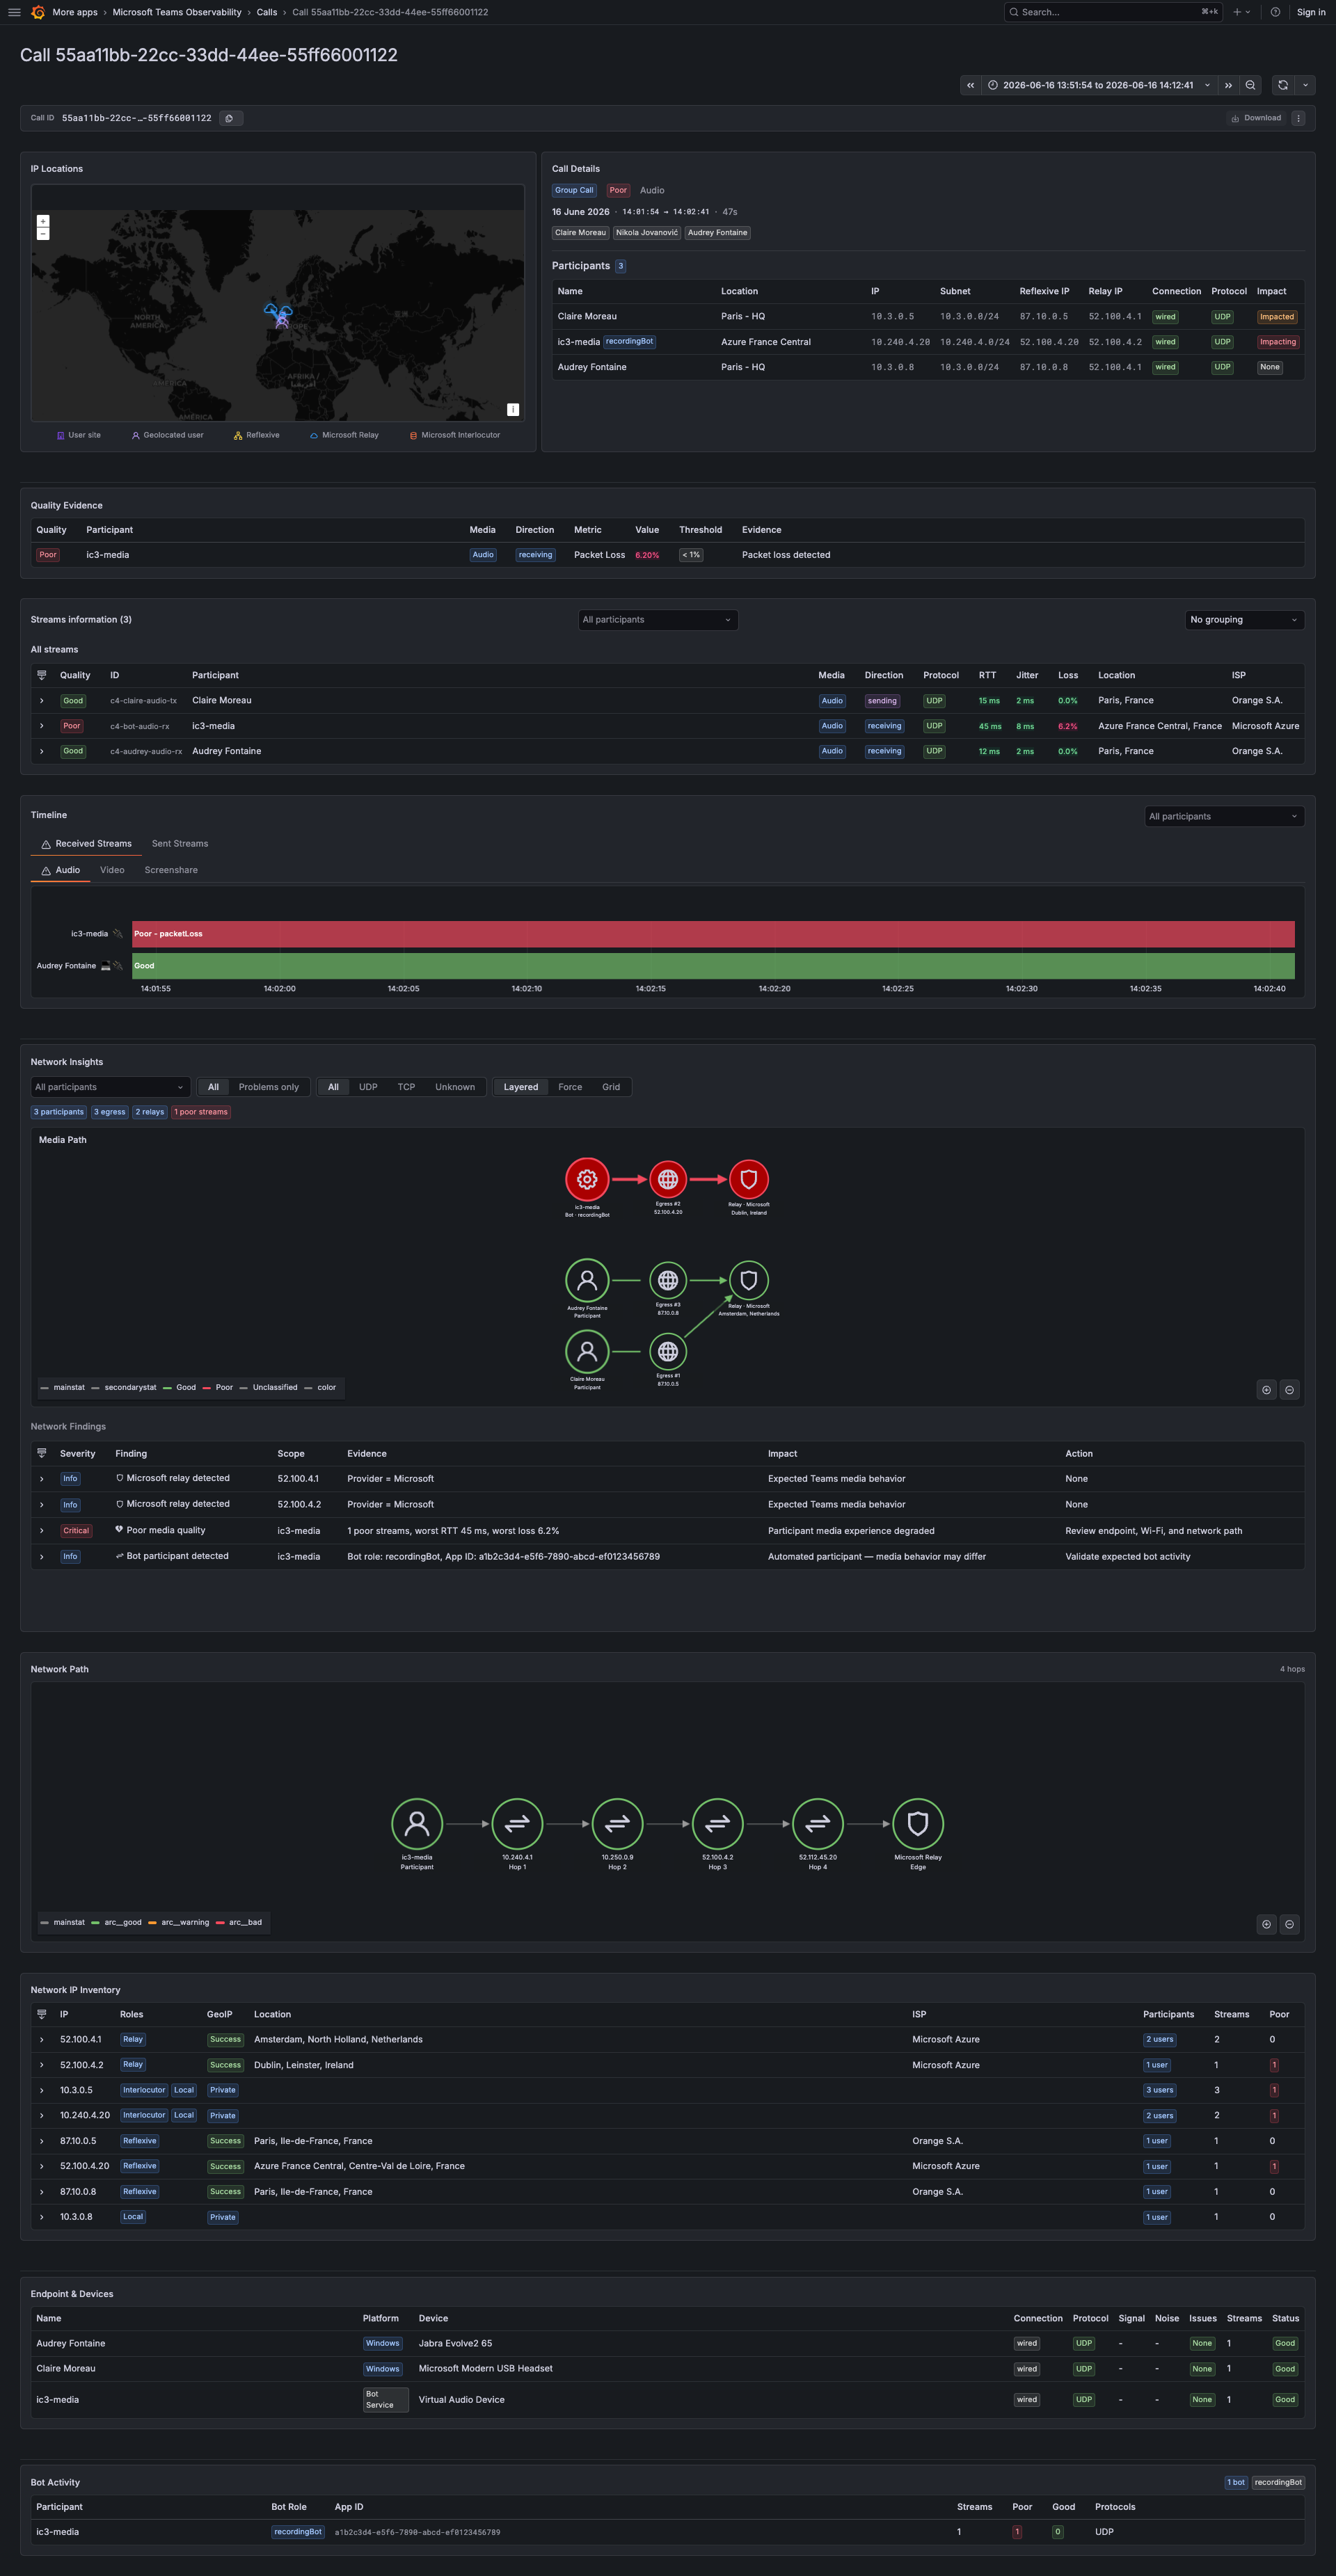
Call Overview Full analysis of a single call — verdict, map, quality evidence, streams, network diagnostics, endpoints.
Users Per-user table: identity, network, call stats, devices, recent calls.
Issues Active and resolved Microsoft 365 service health incidents.
Status License panel, feature status table, and outgoing connection tests.
Provisioning Grafana AppConfig: Microsoft Graph, datasource, GeoIP toggle, subnet mappings.
Health Indicators
Section titled “Health Indicators”| Status | Visual | Meaning |
|---|---|---|
| Good | Green | Call met quality thresholds |
| Poor | Red | Call had quality degradation |
| Unclassified | Grey | No quality data available |
Demo vs Live Mode
Section titled “Demo vs Live Mode”The app supports two modes via the datasource configuration:
- Demo Mode — uses built-in sample data (JSON fixtures in
src/data/). No collector or Loki required. - Live Mode — queries a real Loki datasource with data from the collector. Requires a valid license.
Toggle between modes in the provisioning page: Administration → Plugins → MS Teams Observability → Configuration.