
Home
Detect and resolve Microsoft Teams call issues faster with end-to-end observability from Graph API telemetry to operational dashboards.
MS Teams Observability is a collector + backend integration solution for Ops and IT teams: it pulls Microsoft Teams telemetry from Microsoft Graph and turns it into actionable dashboards and incident context in Dynatrace, Splunk, or any OTLP-compatible backend.
What Do You Want to Do?
Section titled “What Do You Want to Do?” I want to evaluate the product Try the Dynatrace app with built-in sample data. No collector or license required.
I want to deploy for Dynatrace Full setup: collector + Grail bucket + OpenPipeline + dashboards.
I already use Splunk Deploy the collector with Splunk HEC ingestion and the Splunk app.
I use Grafana, Datadog or another OTLP platform Configure the collector to export to any OTLP-compatible endpoint.
I installed it but I see no data Diagnose and resolve missing data issues.
What You Get
Section titled “What You Get”- Faster Incident Triage: correlate call degradations with Microsoft advisories and isolate impacted users or sites faster.
- End-to-End Call Quality Visibility: track call quality from summary to stream-level metrics across users, devices, and networks.
- Multi-Backend Ready: collect once and route telemetry to Dynatrace, Splunk, or any OTLP-compatible backend based on your operating model.
Start in 15 Minutes
Section titled “Start in 15 Minutes”- Check Prerequisites (Azure app, permissions, and network access).
- Deploy the Collector and run your first collection cycle.
- Connect your backend in Backends (Dynatrace, Splunk, or OTLP-compatible).
- Open dashboards and validate live quality and incident data.
How It Works
Section titled “How It Works”flowchart LR
A[Microsoft Graph API] --> B[MS Teams Observability Collector]
B --> C[Dynatrace Backend]
B --> D[Splunk Backend]
B --> G[OTLP-compatible Backend]
C --> E[Dashboards and App Pages]
D --> F[Dashboards and Searches]
G --> H[Your OTLP Platform]
One collector ingests Teams telemetry once and forwards it to your operational backend.
- Authenticate and collect: the collector uses your Azure app registration to call Microsoft Graph on a schedule.
- Normalize and enrich: records are transformed into consistent event families and enriched with context used for operations and troubleshooting.
- Export to one or more backends: the same collection cycle can send data to Dynatrace, Splunk, OTLP-compatible platforms, or any combination.
- Operate from dashboards and app pages: teams investigate degraded calls, impacted users/sites, and Microsoft advisories from a single workflow.
Typical telemetry available after ingestion includes:
- Call metadata and stream quality indicators (for example RTT, jitter, and packet loss).
- PSTN / Direct Routing / Auto Attendant / Call Queue data.
- Microsoft service announcements and collector health signals.
Choose Your Backend
Section titled “Choose Your Backend” Dynatrace Full integration with Grail, OpenPipeline, and a dedicated app for operations and troubleshooting.
Splunk HEC-based ingestion with a dedicated Splunk app and dashboards.
OTel / OTLP Send logs to any OTLP-compatible platform (for example Grafana, Datadog, or Dynatrace OTLP endpoint).
Visual Overview
Section titled “Visual Overview”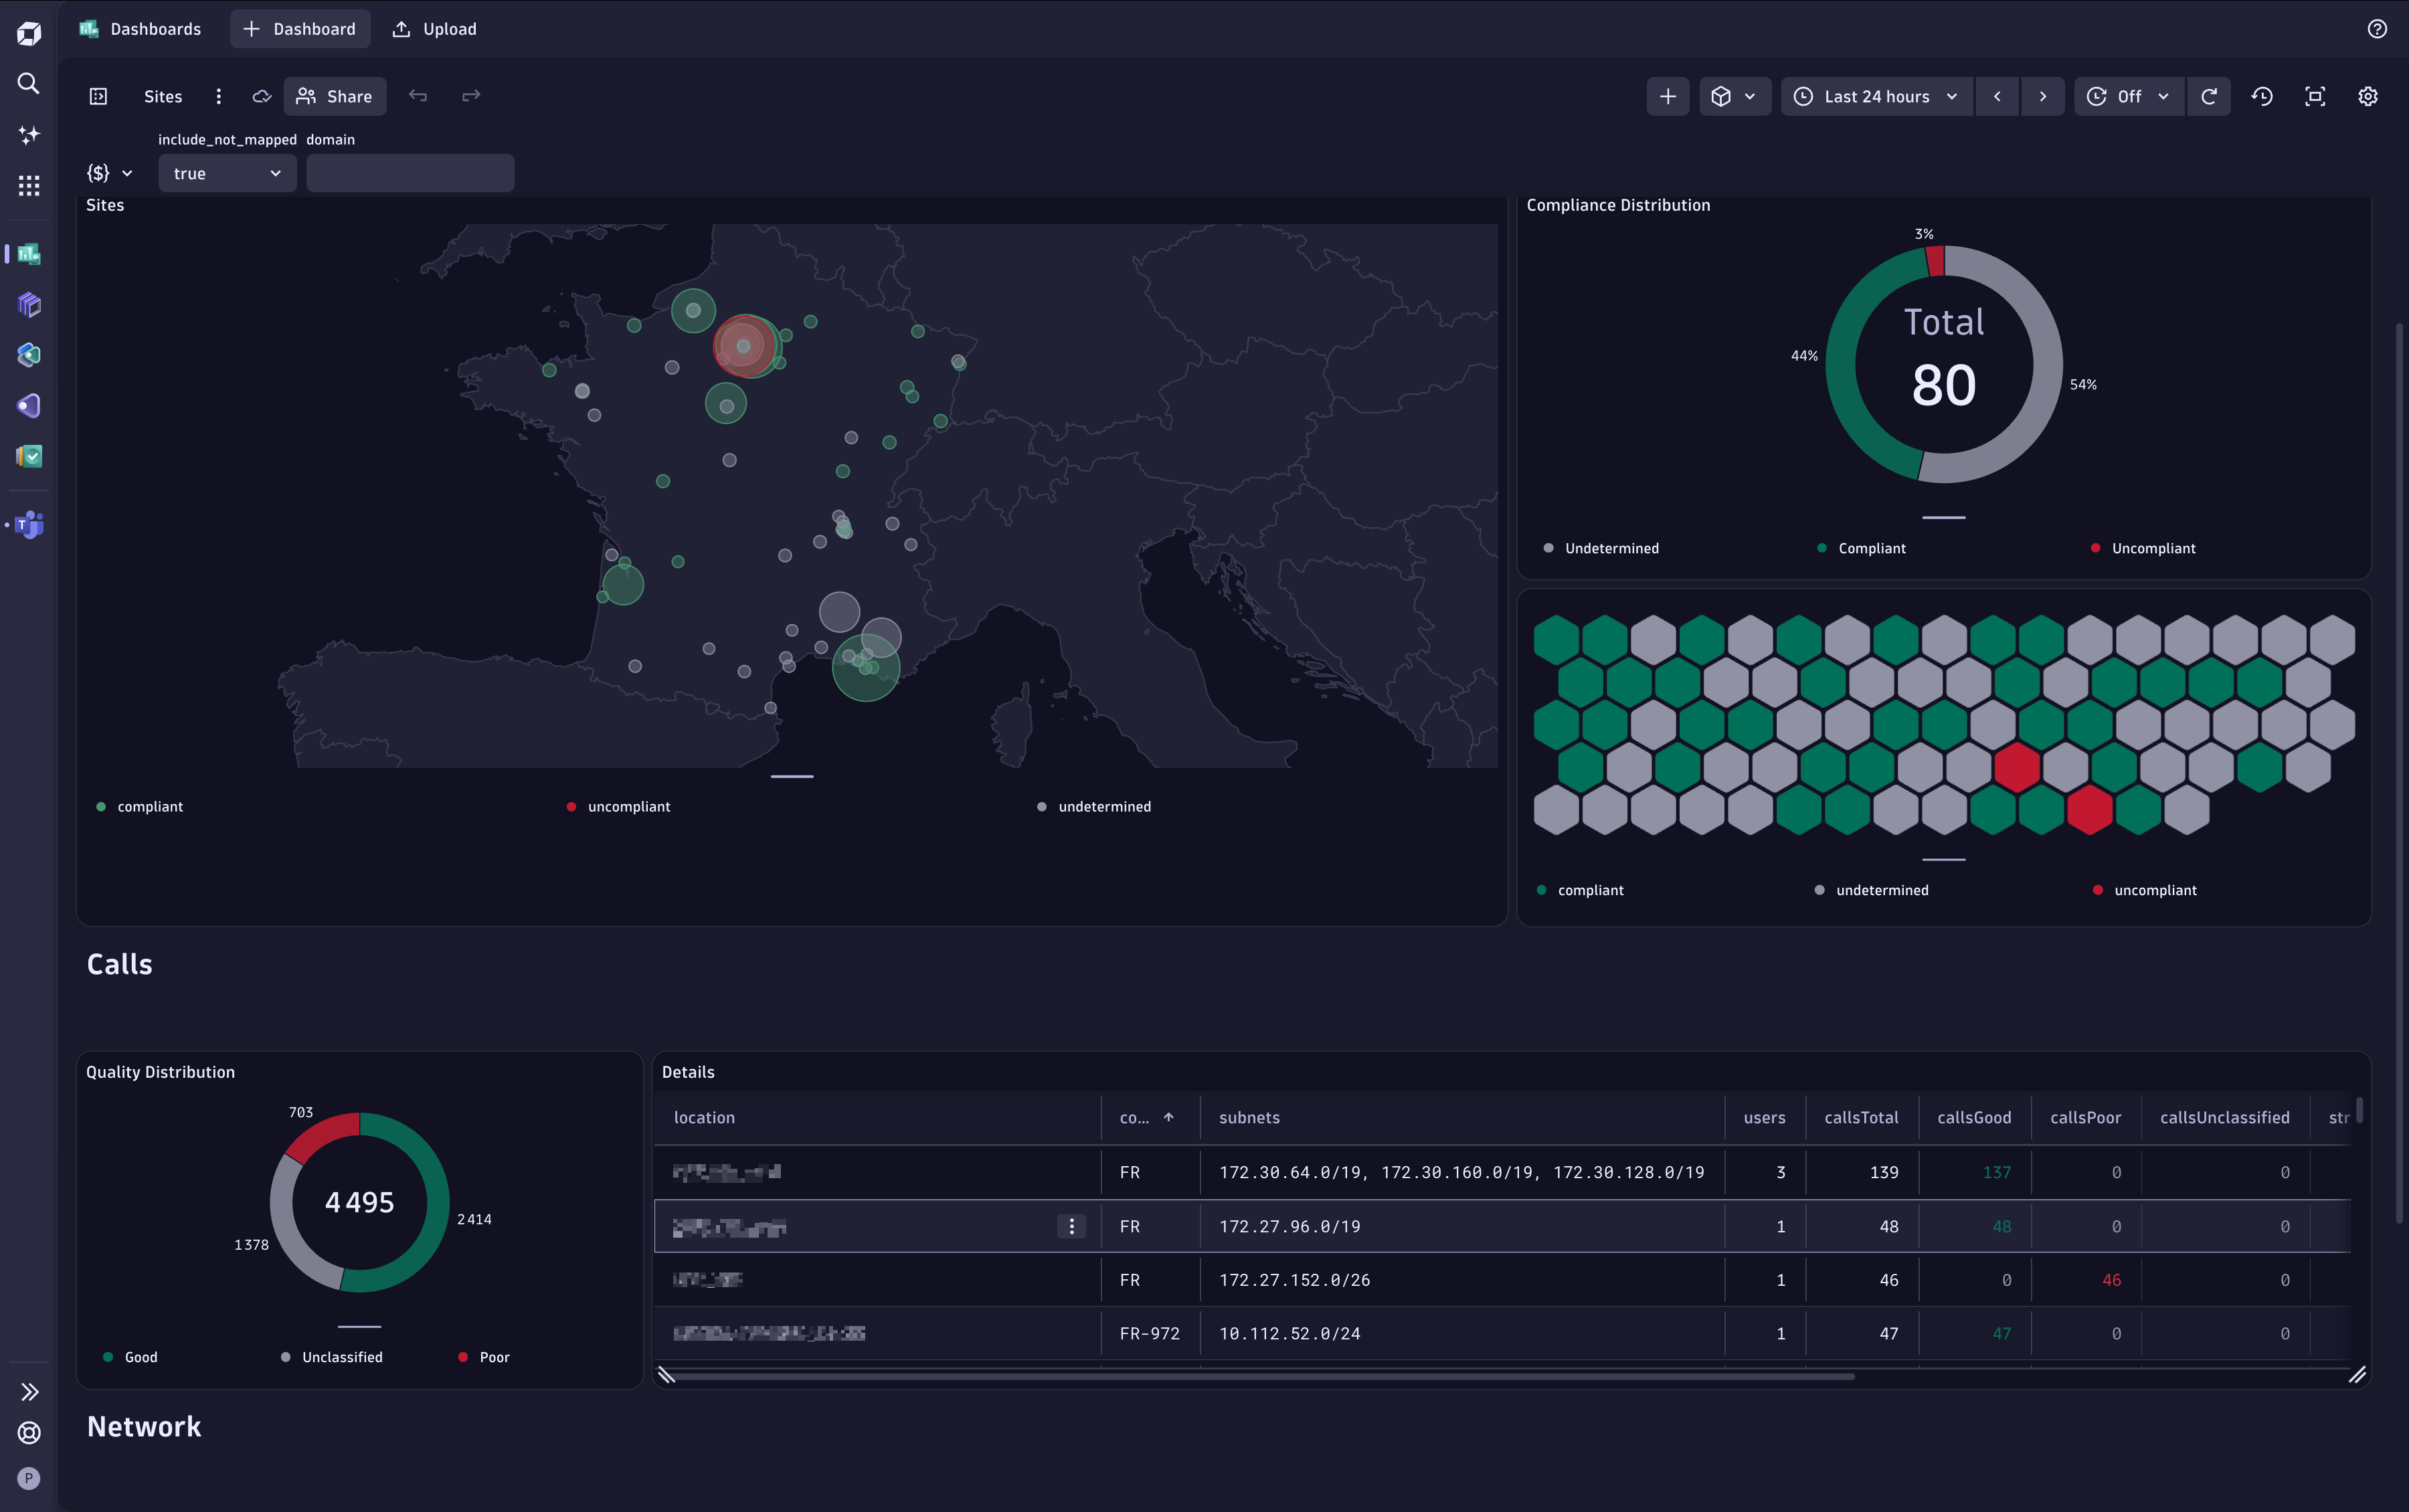
Documentation by Task
Section titled “Documentation by Task” First Deployment Product overview, prerequisites, collector install, and backend connection.
Collector Operations YAML configuration, CLI, service mode, and extension deployment.
Dynatrace Operations Platform setup, app installation, dashboards, and troubleshooting.
Splunk Operations Application installation, dashboard pages, HEC connection, and troubleshooting.
Troubleshooting Quick Access
Section titled “Troubleshooting Quick Access” Collector Troubleshooting Investigate collection/authentication/export issues on the agent side.
Dynatrace Troubleshooting Resolve ingestion, app, and dashboard issues in Dynatrace.
Splunk Troubleshooting Resolve HEC/index/dashboard issues in Splunk.