
Explore the Grafana Integration
The Grafana integration provides a native Grafana plugin application for MS Teams Observability, published on the Grafana Plugin Catalog. It covers:
- Plugin App: A dedicated application with operational dashboards for call quality, user activity, site performance, and Microsoft incident correlation.
- Datasources: Loki-based datasource for Teams telemetry, plus an optional Subnet Location datasource for GeoIP enrichment.
- Bundled Dashboards: Ready-to-use dashboards for call analysis and user activity.
Preview
Section titled “Preview”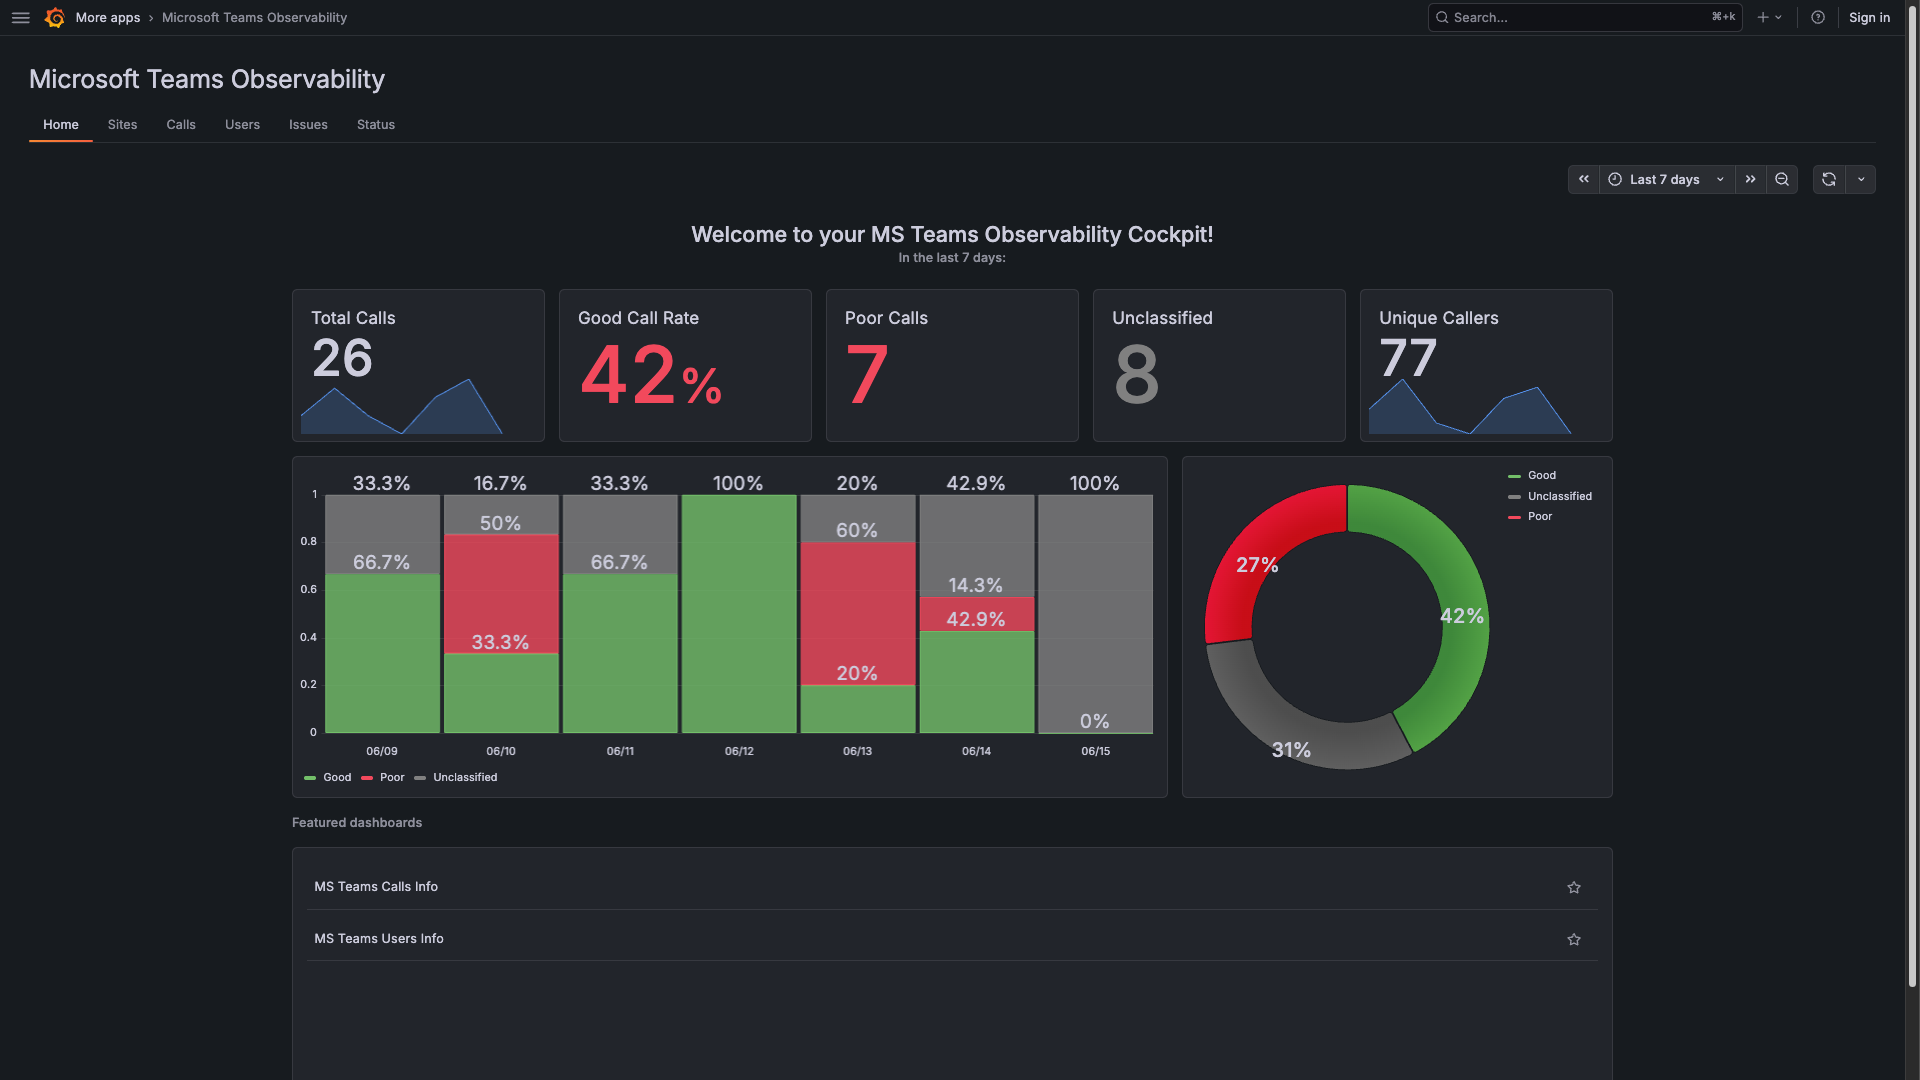
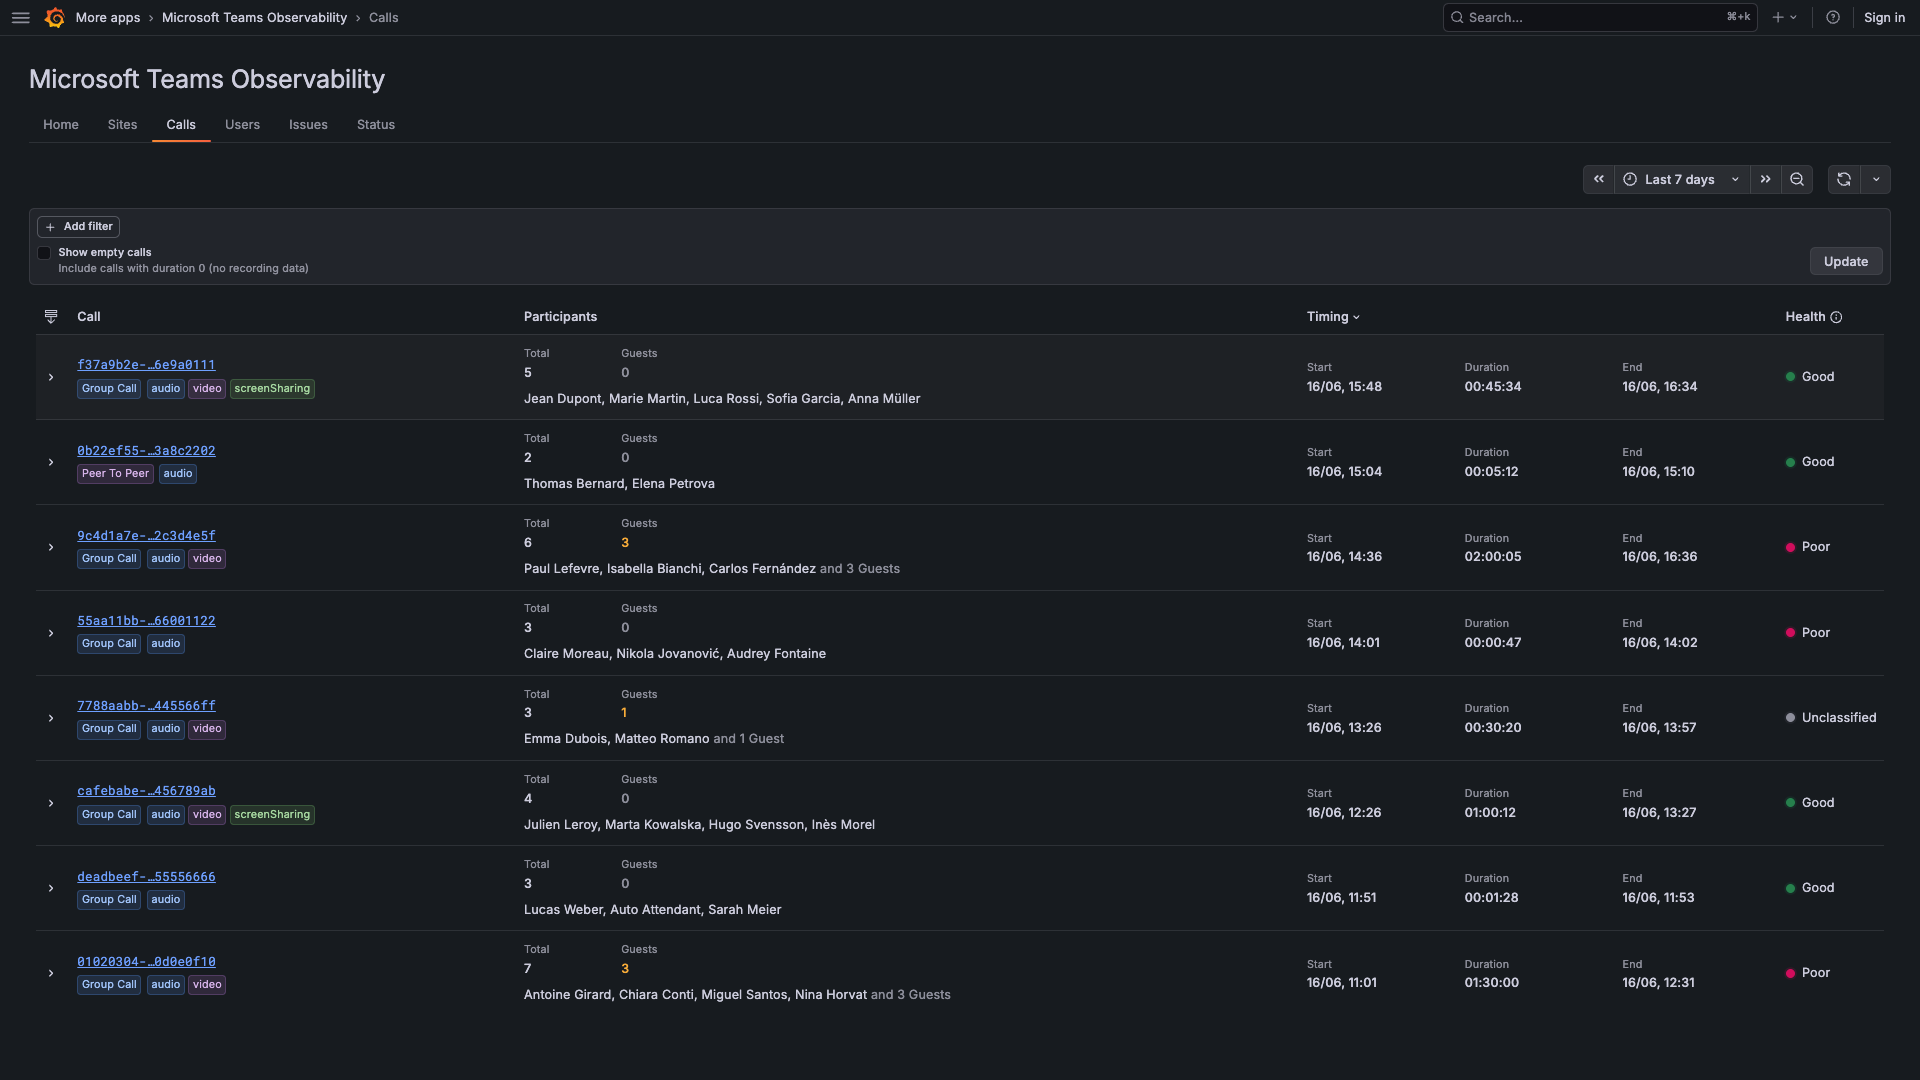
Architecture
Section titled “Architecture”graph TD
A["ms-teams-agent (Collector)"] -->|"OTLP / Loki Push"| B["Loki / Grafana Cloud Logs"]
B -->|"LogQL queries"| C["MS Teams Observability App (dashboards)"]
B -->|"GeoIP enrichment"| D["Subnet Location Datasource"]
Deployment Path
Section titled “Deployment Path” 1) Prerequisites A supported Grafana instance, a Loki datasource, and a collector sending MS Teams logs.
2) Install the Plugin Install the MS Teams Observability plugin from the Grafana Plugin Catalog.
3) Configure Datasources Set up the MS Teams Observability datasource (Loki) and optional Subnet Location datasource.
4) Connect the Collector Configure the collector OTLP output to send logs to your Loki instance or Grafana Cloud.
5) Use the Application User guide for the MS Teams Observability app — Home, Calls, Sites, Users, Issues, and Configuration.
6) Use the Dashboards Explore the bundled dashboards for calls and users analysis.