
Deploy MS Teams Observability with Grafana
Deploy the MS Teams Observability collector and Grafana plugin app to monitor real Teams call quality, user activity, and site performance.
Estimated time: 30–45 minutes
What you will deploy:
- Microsoft Entra app registration for Graph API access
- Collector binary on a Linux or Windows host
- Grafana plugin app from the Plugin Catalog
- Loki datasource (self-hosted or Grafana Cloud)
Before You Start
Section titled “Before You Start”- Microsoft 365 tenant with Teams calling activity
- Entra ID permission to create an app registration
- Admin consent for Graph application permissions
- Collector host with outbound HTTPS access to
graph.microsoft.com - Supported Grafana instance
- A Loki datasource (self-hosted or Grafana Cloud Logs)
- License file for live mode (see License)
Step 1 — Create Microsoft Entra App
Section titled “Step 1 — Create Microsoft Entra App”Follow the canonical guide: Azure Permissions.
At the end, you must have:
tenant_idclient_idclient_secretorclient_certificate_path
Step 2 — Install the Collector
Section titled “Step 2 — Install the Collector”Follow Collector Installation to download the binary and build your config.yaml.
Your minimum config with Grafana OTLP output:
microsoft_authentication:  graph:    tenant_id: "<tenant-id>"    client_id: "<client-id>"    client_secret: "<secret>"
license:  filepath: /etc/ms-teams-observability-agent/license.json
output:  otel:    - name: "grafana"      enabled: true      endpoint: "https://otlp-gateway-prod-eu-west-2.grafana.net/otlp/v1/logs"      service_name: "msteams-callrecords"      deployment_environment: "production"      headers:        Authorization: "Basic <base64-credentials>"
collection_config:  interval_collection_minutes: 10  max_call_duration_hours: 5  features:    calls_collection:      enabled: true
Use the Grafana Cloud Logs OTLP endpoint and credentials from your Grafana Cloud stack details.
Step 3 — Install the Grafana Plugin
Section titled “Step 3 — Install the Grafana Plugin”Follow Plugin Installation to install the MS Teams Observability plugin from the Grafana Plugin Catalog.
Step 4 — Configure the Datasource
Section titled “Step 4 — Configure the Datasource”- Go to Connections → Data Sources → MS Teams Observability Datasource
- Enter your Loki URL, tenant ID, and credentials
- Set Service Name to
msteams-callrecords - Click Save & test
Step 5 — Validate
Section titled “Step 5 — Validate”-
Validate collector config:
Terminal window ms-teams-agent validate --config ./config.yaml -
Test Graph auth and OTLP connectivity:
Terminal window ms-teams-agent test-connection --config ./config.yaml -
Run one dry cycle:
Terminal window ms-teams-agent run --config ./config.yaml --dry-run
Step 6 — Verify Data
Section titled “Step 6 — Verify Data”- In Grafana, open Apps → Microsoft Teams Observability
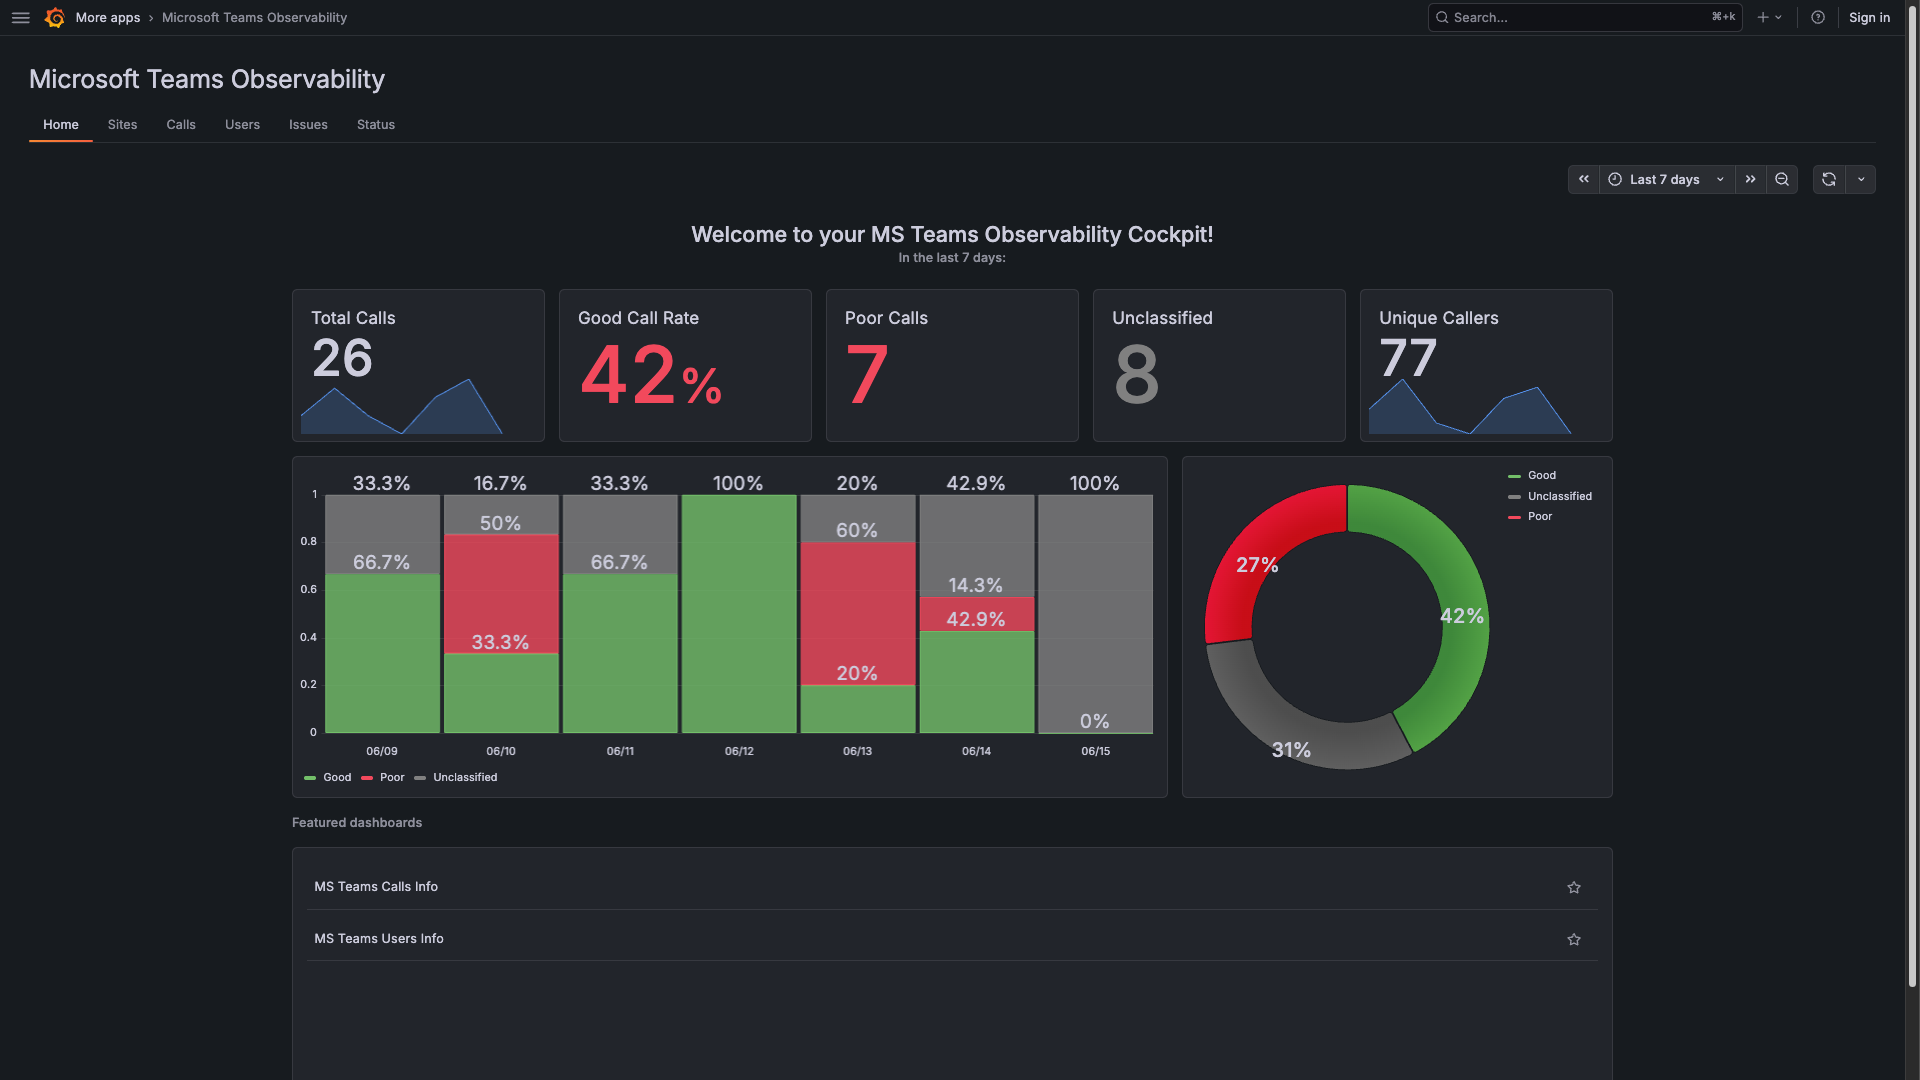
- The Home page should show real tenant data
- Navigate to Calls to see individual call records
- Check Call Overview for stream-level quality details
Next Steps
Section titled “Next Steps”- Explore App Pages for calls, sites, users, and issues
- Upload a sites file for site-level dashboards
- Configure service mode for production persistence